With so many different types of data, platforms, and devices to contend with in the financial services industry, it’s no wonder that JavaScript frameworks and libraries have become vital shortcuts for web development teams of all sizes. Financial services encompass everything from trading activity, to banking, to accounting, financial planning, and a lot more, so it's more important than ever for web development teams to find efficient and scalable ways to present the data produced from this financial activity.
As data complexity increases across various financial sectors, so does the demand for tools that can keep up with visualizing it. This is especially true for the charts, diagrams, and infographics that help to visually convey that data both internally and externally. It’s no longer enough to produce static data visualizations that look good — they must also be interactive and dynamic to reflect the nature of the data they’re representing.
For example, if you want to visualize data points at different time intervals, or want to isolate or highlight a specific chunk of data in an otherwise large dataset via zooming, or want to include a live-feed of real-time data, you’ll need a tool that produces more than just flattened chart renderings. This is where JavaScript libraries like ZingChart can make all the difference in your web development workflow by making it easy to produce interactive, dynamic data visualizations quickly.
ZingChart is a well-established, US-based charting library that has been used by companies like Adobe, Nasdaq, Fidelity Investments, K&H Bank, ING Bank, and London Stock Exchange. It gives web developers the power to create highly interactive and responsive charts, diagrams, and infographics for their apps and websites with only a few lines of code. With over 35 chart-types and modules, including chord, pareto, and gauge chart types, ZingChart is uniquely suited to help developers visualize a wide range of financial data.
From time series data, to zooming, real-time feeds, tooltips, and shared interactions, ZingChart is packed full of functionality that’s meant to make the job of producing data visualizations much easier for experienced web developers. It also integrates well with many popular frameworks, including Angular, React and PHP.
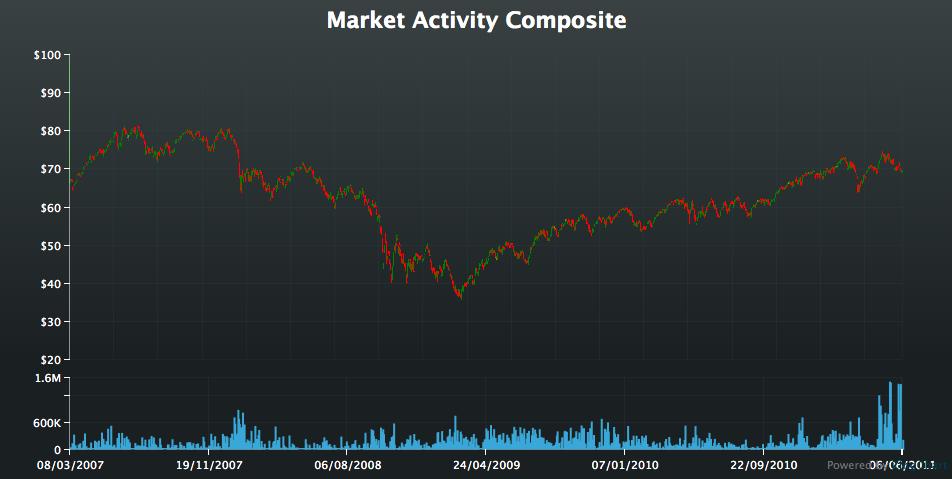
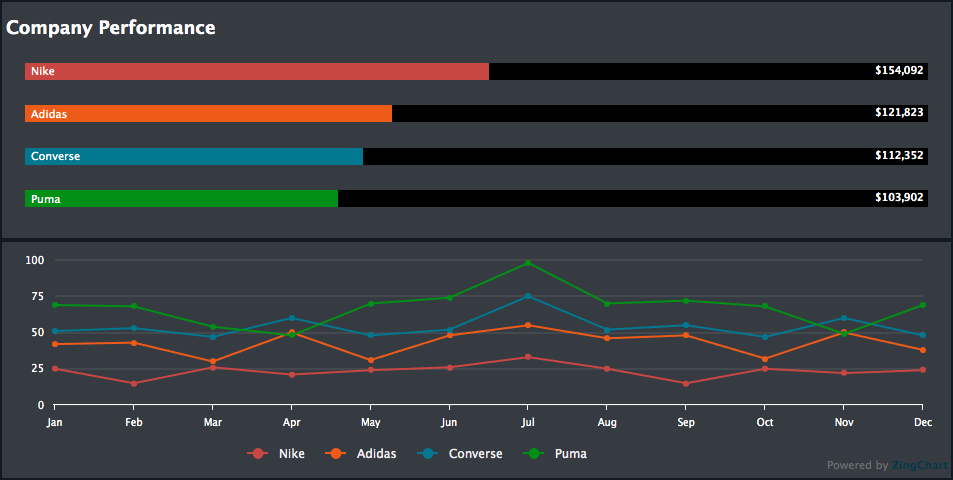
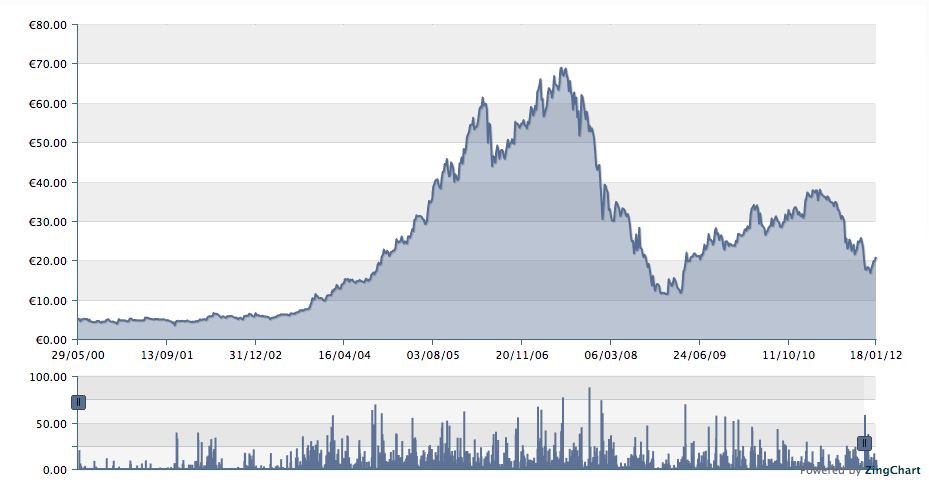
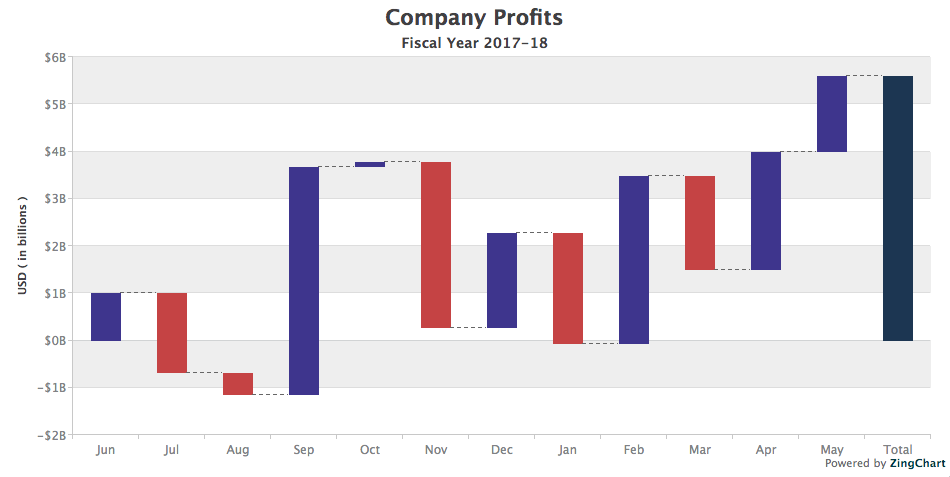
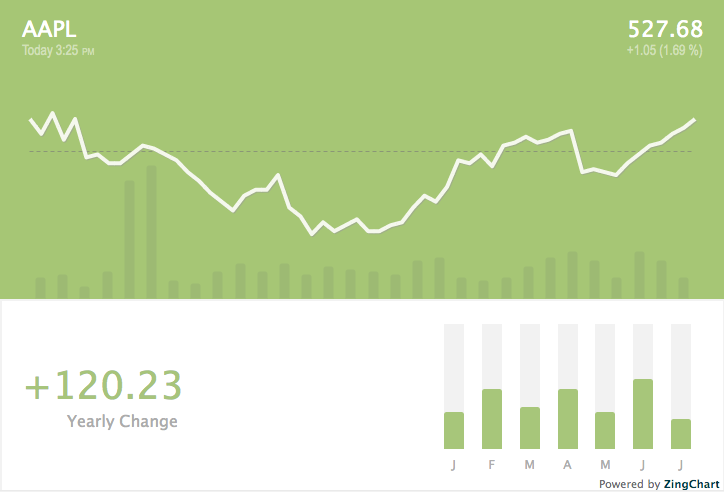
If you’d like to see live examples of financial data visualized with ZingChart, we have many! Take a look at our Interactive Sales Dashboard demo, our Mixed Line/Pie Dashboard demo, our Mixed Time Series demo, our Zoomable Stock demo, our Animated Waterfall demo, our Mixed Whisker Bar Stock demo, our Stepped Area Crosshair demo, our Animated Dashboard with Tooltips demo, or our Stock and Volume Chart with Blended Scales and Interactive Crosshairs demo to start.
To learn more about how ZingChart can help improve and streamline your team’s data visualization workflow, visit our site at https://zingchart.com, or get in touch with us. We’re a team of experienced developers who are passionate about data visualization, and we’d like to help you figure out custom solutions for your team’s finance-related use cases.
I also encourage you to check out the blog post I wrote about how our sister product, ZingGrid, can also help streamline your development team’s data visualization workflow for financial data. ZingGrid is a mobile-friendly, CRUD-ready JavaScript library for creating interactive data grids and data tables. Together, ZingGrid and ZingChart form a powerful suite of data visualization products that are sure to help take the headache out of visualizing financial data for your development team.
A pioneer in the world of data visualization, ZingChart is a powerful JavaScript library built with big data in mind. With over 35 chart types and easy integration with your development stack, ZingChart allows you to create interactive and responsive charts with ease.