This post is the second part of a three part series where I am going over all of the major improvements that have been added to ZingGrid from v.1.5.0 up to now (v.1.7.1-0) to show off all the hard work the Zing team has put in. (If you haven't read the first part on filtering I would check that out here).
This post in particular will be focused on the new grouping & aggregation mechanics in ZingGrid. If at any point you'd like to skip straight to the docs, here are links to the grouping specific docs and the aggregation specific docs.
Row Grouping
In certain cases it can make sense to convert your flat data into a structured, tree-like format. This lets users drill into a large dataset to see exactly what they need without having to click through pages or use any filters.
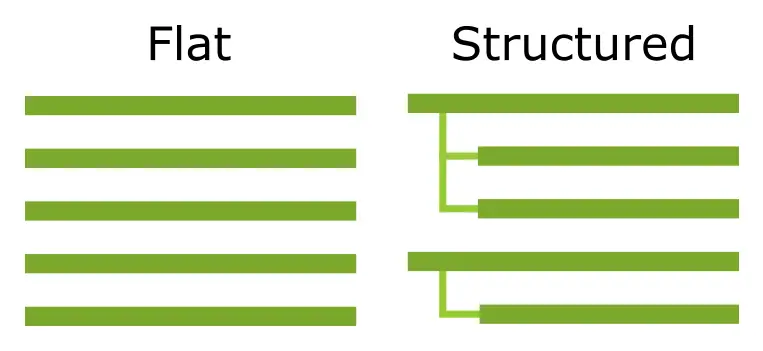
Here we’re using the example of our fake company VoltVoyage’s financial information month over month. You can start at the top level by drilling into a year you are interested in, then the month, and view all of the days in that month and each day’s revenue, cost, and profit.
How to Use
Implementing this is simple, just add one column of type="row-group" to your ZingChart
<zg-column type="row-group" index="date.year,date.month"></zg-column> The type="row-group" attribute specifies that this column is not a normal column on the table, but is instead specifying how the columns should behave (in this case, they should be grouped)
The index="date.year,date.month" attribute is specifying which key(s) should be used to group the columns together. Notice here that I am using two keys - you can use less or more, so long as if you have more than one they are separated by commas. The keys are nested left to right, so in this case they are grouped first by their year, and then inside each year they are grouped by the month.
Interactable Demo
Aggregate Columns
Often times it is useful to perform calculations on datasets without having to store that data with the set itself. Aggregate columns allow us to perform these calculations at runtime so we only have to store the necessary data.
In our demo below we have a table showing how many hours each employee at VoltVoyage worked in the past week. Using aggregate columns we’re able to display the average daily number of hours each employee worked, and the sum of all of their hours that week.
Also included in the demo are row aggregates in the form of the foot-cell attribute. Using these I am able to display the average number of hours worked for each day across all employees.
How to Use
Add your <zg-column>s anywhere inside your grid, just make sure to set their type to aggregate and select a method for the type-aggregate-value attribute (list of methods here).
<zg-column type="aggregate" type-aggregate-value="sum"></zg-column>
<zg-column type="aggregate" type-aggregate-value="avg"></zg-column>
To customize the result of this aggregate value we can create a renderer function (the parameters of which are specified below). Whatever we return will be rendered as HTML. In this case, I’m adding the summation symbol to the sum value. We just need to make sure it is exposed to the window object so ZingGrid can access it.
<zg-column
	type="aggregate"
	type-aggregate-value="sum"
	renderer="aggregateSumRenderer"
></zg-column>

<script type="module">
	/**
	 * Renderer function used by the "Sum" aggregate zg-column.
	 * Turns the aggregated value into a mathematical string for sums.
	 * @param {Object} recordData - The key:val pair of the entire row
	 * @param {Array} aggregateData - An array of just the rows values
	 * @param {String} aggregateValue - The row's computed average
	 * @returns {string} HTML string to be rendered in the cell
	 */
  function aggregateSumRenderer(recordData, aggregateData, aggregateValue) {
	  return `Σ=${aggregateValue}`;
  }
  // Make sure function is available on the window object
	window.aggregateAvgRenderer = aggregateAvgRenderer;
</script>
Interactable Demo
Row Selection
Checkboxes are a nice visual aid but they can sometimes be a bit cumbersome to select, especially if the data grid has to scroll horizontally in any way. Luckily the selection API is now exposed so we can extend how we interact with the grid.
In our demo below we show an easy way to select and delete multiple rows at once by clicking anywhere on any row to select or deselect it.
How to Use
All you need is the index of the zg-row you would like to select and a reference to the <zing-grid> element. Once you have those, you can use the selectRow() and deselectRow() methods like so
zingGridRef.selectRow(rowIndex);
zingGridRef.deselectRow(rowIndex);