June was a busy month for the ZingChart team. We’ve been building cool new demos, developing third party integrations, and adding new features. Let’s take a look at some of these recent developments, as well as some of the impressive activity in the JavaScript and dataviz communities.
JavaScript and Dataviz Links of Interest
JavaScript News and Releases
Brendan Eich announces WebAssembly
JavaScript creator Brendan Eich recently announced WebAssembly, a new binary compile format that aims to bring more features to the web stack via the use of lower level languages. This W3C Community Group has contributions from:
- Mozilla
- Microsoft
- and more.
Eric Elliott wrote a fantastic Medium article explaining this exciting development in the JavaScript community!
NPM Launches npm3 Beta
NPM (node package manager) has released npm3 beta, touted to be a “near-total” rewrite, so NodeJS users, pay attention! Version 3.0.0 will remain in beta until stable and NPM will continue pushing releases to npm2 during that time. Read all about in the release notes.
ECMA6 Officially Approved
ECMAScript 2015 (aka ECMA6), the most significant update to ECMAScript since 1999, has been officially approved by the ECMA International General Assembly. It’s formalization means that browser developers can now complete their implementation of ECMA6 features without fear of changes to the specification. Check out the official documentation to learn about the new features in the spec.
ZingChart News and Releases
ZingChart v2.1.1
We kicked off June 2015 with ZingChart build 2.1.1, which included some minor bug fixes and syntax additions, but also some cool new legend features.
ZingChart + Your Framework or Database
We understand that most charts aren't made in a vacuum. With that in mind, the ZingChart team has been working hard to demonstrate a wide range of use cases in our new Github demo repo. Don’t see your framework or database in our demo list? Drop us a line and let us know which tool you’d like to see a demo for next!
What makes ZingChart Better?
The admins over at developer community Devmag.io tapped us to answer a member’s question about how ZingChart stacks up against other popular charting libraries, like Highcharts. Check out our very own Merrily Chopp’s thoughtful answer to this important question.
Dataviz Around the Web
FEMA’s Disaster Dataviz Tool
The United States Federal Emergency Agency (FEMA) released an interesting new dataviz tool that allows users to explore disaster declarations and grants by location, year, month, and disaster type. They’ve also made the data set available to the public, for those of you who are interested in making a dataviz of your own.
Boxplots and Big Data
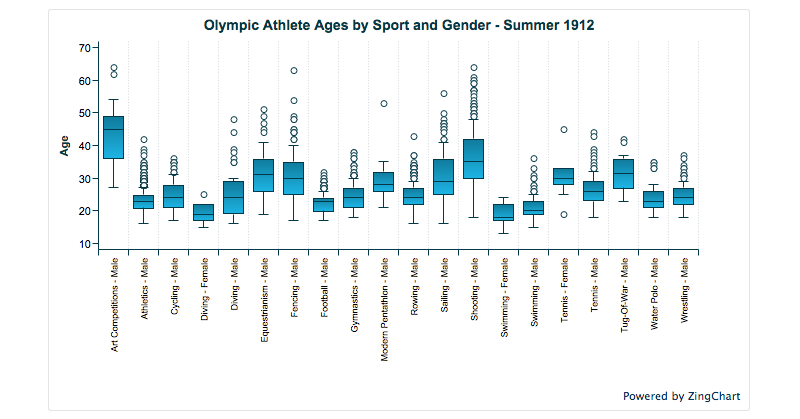
We took some time this month to demystify boxplots, a potentially underused chart type in the dataviz field. Come for the guide, stay for the interactive big data boxplot using 119 years worth of data!
Nathan Yau Recreates the Statistical Atlas
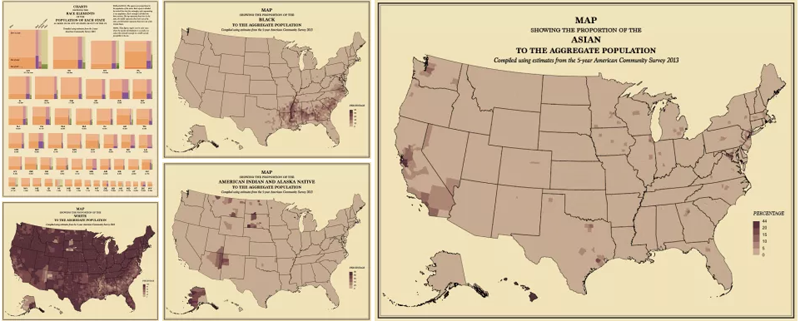
Lamenting the recent loss of the Statistical Atlas of the United States, Nathan Yau of Flowing Data decided to take matters into his own hands. Using only publicly available data from US government websites, Yau has recreated the Statistical Atlas with recent data in the style that we all know so well. Well done!
More JavaScript and Dataviz links
Have interesting news or projects that you’d like to share? Let us know in the comments below!