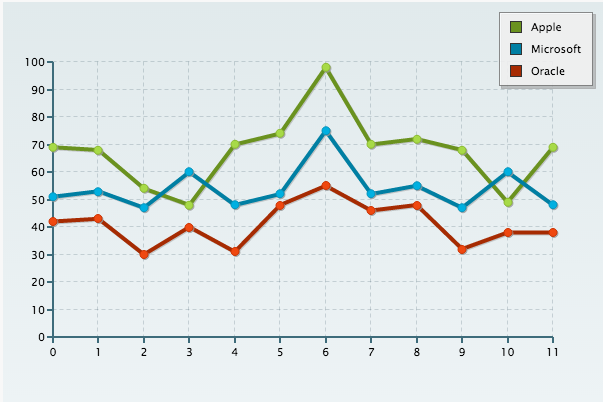
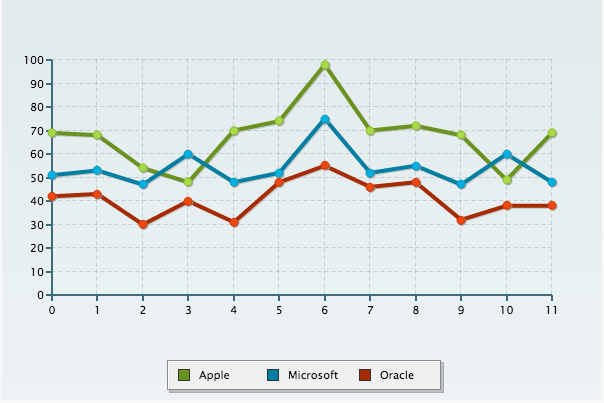
The latest build for ZingChart is out. Version 2.1.1 contains several usability enhancements and one of the biggest ones relates to a commonly used chart feature: legends.
Legends are of vital importance when it comes to understanding a chart. According to Robert L. Harris in Information Graphics, that is because, “They frequently contain information necessary for decoding the data graphics.”
So making these critical components of dataviz easier to use in our JavaScript charting library was a logical step.
Legend Alignment in ZingChart
By default, a ZingChart legend has a vertical layout and is positioned at the top right corner of the chart.

But what if other elements need to be visible in this area of the chart?
What if you prefer your legend on the bottom or the left?
ZingChart has always given users the tools to adjust legend layout and positioning, and now controlling how the legend is displayed is easier than ever.
Align and Vertical-Align
In this build, we are introducing two helper attributes inside of the legend object: align and vertical-align. If you are familiar with CSS, then these attributes and their values shouldn’t seem too foreign.
Here’s a chart with the legend vertically centered, and on the right with no plot area underneath.

Take a look at the JSON used to accomplish this before (below left) and the JSON used with them in the new build (below right).
Before, there were three somewhat laborious steps:
-
We needed to use x/y positioning (or margins) to move the legend.
-
The plot area needed to be manually adjusted to accommodate the legend below the chart.
-
The layout had to be manually set to “h” for horizontal.
As of ZingChart 2.1.1, those steps are accomplished with two much more simple steps:
-
Setting “align” to “center”
-
Setting “vertical-align” to “bottom”.
Here are the new attributes and their accepted values:
align: left | center | right

vertical align: top | middle | bottom
This should make your life easier when dealing with legends, but the old attributes will still be there for those times that you need more granular control of layout and positioning.
Other New Build Goodies
This build also includes a few minor additions and some bug fixes:
-
active-areahas been added to area charts -
Border transparency can now be set on borders with
border-alpha -
adjust-layouthas been added to the preview object
For the full details, read the full 2.1.1 release notes in the ZingChart changelog.
Get the New ZingChart Build Today
Interested in test driving these new features with your charts and graphs? Try the new build for free today.
