
Data visualization for sales use cases can be a tough nut to crack for some web developers, especially if the sales processes their apps are built around aren't well-defined. The last decade and a half of technological development has given businesses at all levels unprecedented access to sales tools that suit a broad range of scenarios, workflows, and pipelines. The growth of the e-commerce economy has only further accelerated this transition.
This has given web developers a chance to introduce disruptive, flexible sales products and services that accommodate more unconventional styles of selling. These new offerings are no longer constrained to only enterprise-level projects, and are increasingly also being used across a broader spectrum of business entities including start-ups, entrepreneurs, and small to mid-size organizations. Indeed, for a considerable portion of these business entities, these sales tools might be their first explorations into establishing anything resembling a sales workflow at all.
So what part do charts, graphs, diagrams and infographics play in these sales scenarios? And how can web developers use the power of ZingChart's interactive JavaScript charts to maximize the value of their users' sales data? Charts are one of the quickest ways to visually summarize and communicate data insights regardless of the size of the dataset in question. They're invaluable visual representations that can help in guiding business and sales development.
Given the variety of sales use cases that different business entities might need, it's important to use a JavaScript charting library that can accommodate many different chart types. ZingChart has more than 35 built-in chart types that can visualize everything from the well-known (bar charts, line charts, pie charts, etc) to the more complex (network diagrams, funnel charts, choropleth maps, etc). This means that regardless of the sales scenario or business entity they're building for, ZingChart is the only charting tool most web developers will need to get the job done.
By making charts interactive, developers can also begin to control the way their users access their sales information to maximize its impact. Using ZingChart's built-in features like drilldown, tooltips, value boxes, custom scales, mixed charts, and a JavaScript API (to name a few), web developers can control the information density in the charts they include in their apps and websites.
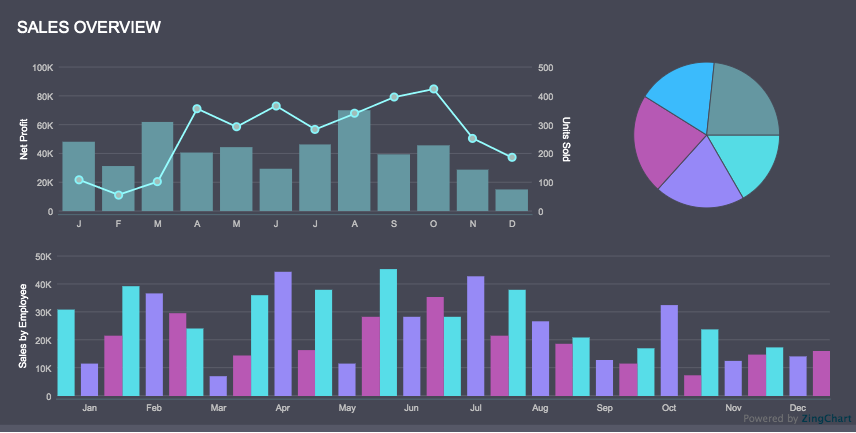
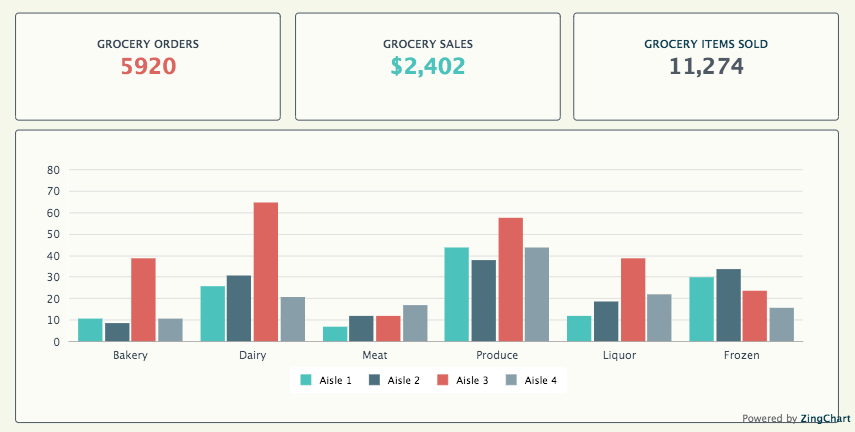
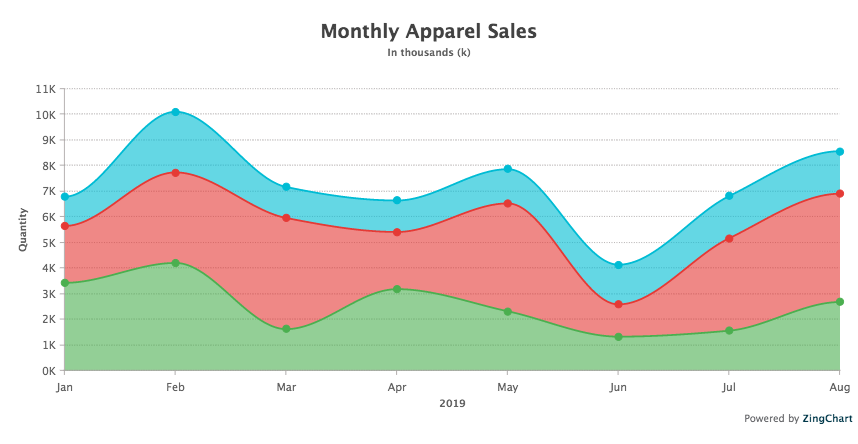
When combined into configurations like dashboards and widgets, these interactive, responsive charts can become the backbone of the sales products and services that modern web developers are building. Whether these tools are bespoke solutions for internal teams, or OEM solutions that are going to be resold to an end customer, ZingChart can help web developers not only visualize, but maximize the insights in their users' sales data.
Whether the sales chart use case is large or small, here's a list of additional live demos that show ZingChart's versatility as a web development tool:
- Animated Horizontal Bar Chart demo
- Area Chart Custom HTML Tooltip demo
- 3D Column Chart demo
- Horizontal Stacked Bar Chart demo
- Line Pie Dashboard demo
- Mixed Chart with Secondary Axis demo
- Bullet Rules Tokens demo
- Animated Bullet Gradients demo
- SaaS Sales Funnel Chart demo
To learn more about how to use ZingChart in your next sales web development app or website, visit the ZingChart website to chat with us, or get in touch with the ZingSoft team via our contact page. We've been trusted with advanced data visualization solutions for organizations of all sizes worldwide for over ten years, and we'd love to help you.
Also make sure to check out ZingChart's sister product, ZingGrid, to learn how to easily build CRUD-ready data grids and data tables with only a few lines of code. Together, ZingGrid and ZingChart form a powerful suite of data visualization products that are meant to make it easier than ever to make your sales data look good.
A pioneer in the world of data visualization, ZingChart is a powerful JavaScript library built with big data in mind. With over 35 chart types and easy integration with your development stack, ZingChart allows you to create interactive and responsive charts with ease.