Hey! This is part two in a long series of chart types in five minutes. Pie charts are in our top three charts used. Let's show you everything you need to know about pie charts.
Pie Chart Breakdown
We have a basic HTML template for all of our chart types included in our download package here.
HTML
The easiest way to get started is by referencing our CDN link. Place this in the head of your HTML Document. Next, create a <div> to hold your chart. Give it an ID we can reference later.
<!DOCTYPE html>
<html>
  <head>
  <script src= "https://cdn.zingchart.com/zingchart.min.js"></script>
  </head>
  <body>
    <div id="chart-div"></div>
  </body>
</html>
CSS
Give your chart <div> some height & width. Your chart will not render otherwise.
#chart-div {
  height: 350px;
  width: 600px;
}
JavaScript
Declare a variable to hold your chart data. The type attribute is used to declare your chart type. In this case, we will be using 'pie'.
var chartData ={
  type: 'pie', //'pie3d', 'ring', & 'ring3d' also available
};
Place your data into the series attribute. You can hard code into an array or refer from a database.
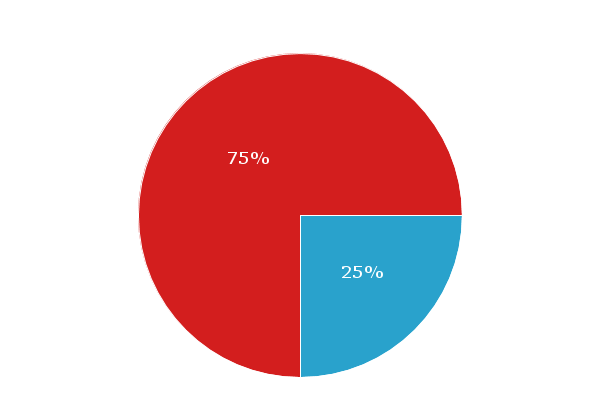
var chartData ={
  type: 'pie',
  series: [
  {
    values: [35]
  },
  {
    values: [75]
  }
  ]
};
Finally, use the ZingChart render function to display the chart.
zingchart.render({
  id: 'chart-div',
  data: chartData
});
When you finish all of that, your document should look like this:
<!DOCTYPE html>
<html>
  <head>
    <script src= "https://cdn.zingchart.com/zingchart.min.js"></script>
    <style>
      #chart-div {
        height: 350px;
        width: 600px;
      }
    </style>
  </head>
  <body>
    <div id="chart-div"></div>
    <script>
      var chartData ={
        type: 'pie',
        series: [
        {
          values: [35]
        } ,
        {
          values: [75]
        }
        ]
        };
      zingchart.render({
        id: 'chart-div',
        data: chartData
      });
    </script>
  </body>
</html>
Pie Chart Overview
-
Pie charts show the qualities of the different categories that make up a whole.
-
Each piece will be sized representative of the quantity it holds.
-
Slices will add up to 100 or 100%.
Which Data Is Best Suited For Pie Charts
Multiple Series: Pie charts will need to be multiple series. Each series represents a slice of the pie.
Common Ways To Input Data Into Pie Charts
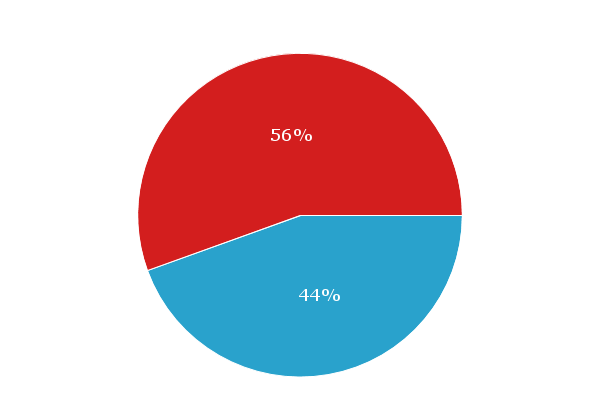
Our pie charts will automatically convert number values into percentages. Take this example below. This is the standard & organized way to input data into pie charts. It keeps things very succinct and clear.
Variables & Arrays
var pizza = [100];
var hamburgers = [125];

var my config = {
  type: 'pie',
  series: [
  {
    values: pizza
  },
  {
    values: hamburgers
  }
  ]
};
This will be the output.
How To Use Pie Charts
-
Comparing values of different quantities.
-
Comparing parts as a whole.
How Not To Use Pie Charts
There are popular data visualization principles we can use to ensure you are using bar charts correctly. Here are a few:
-
Don't use too many slices or compare too much data
-
Don't use 3d. It distorts user comprehension of how big slices really are.
-
Make sure data values equal up to 100%
Most Relevant Interactive Features
-
Legend: An easy way to toggle through data. Useful for isolating pie slices.
-
Value Boxes: These are the labels you inside of pie charts. It makes it easy to see what exactly is being exhibited.
-
Tokens: Tokens give you a way to exhibit important data from charts in tooltips and other text areas.