Quite a few people have been asking us what the "black box with the question mark" on our HTML5 charts are when rendered on a mobile device such as the iPhone or iPad. After seeing how pleasantly surprised they are after they find out, I figured it was time to reveal the mystery. This "black box" that (by default) only shows up on mobile devices rendering HTML5 charts is actually a GUI for accessing the ZingChart right-click context menu. This allows mobile chart users to reload, view as JPG/PNG image, and access some very cool features that you probably don't yet know exist.
HTML5 GUI: Default Mobile Context Menu Button
By default, the context-menu button is placed in the top left corner of the chart and is set to visible.
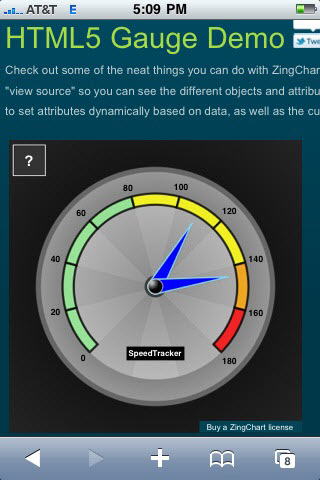 Default mobile "context-menu" GUI on HTML5 Gauge chart via iPhone 3G.
Customizing the Mobile Context Menu Button
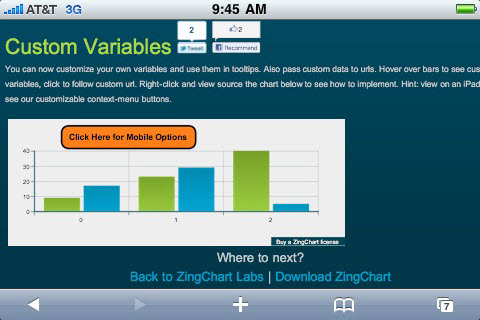
By adding the "context-menu[mobile]": object outside of "graphset": in your JSON packet, you can hide, position, and customize how this button looks to your end user. It's even possible to use an image to add your own custom menu button.
The colors, fonts and padding of the dropdown menu are all fully customizable:
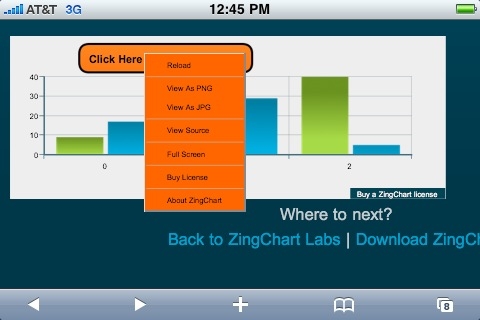
Here's how we customized the above mobile context menu button:
{
 "gui" : {
     "context-menu[mobile]" : {
         "background-color" : "#ff6600",
         "item" : {
             "padding" : "5px 30px",
             "background-color" : "#ff6600",
             "border-color" : "#ff6600"
             },
         "button" : {
             "text" : "Click Here for Mobile Options",
             "margin" : "10px 200px auto 100px",
             "padding": "15px 15px 7px 15px",
             "background-color": "#ff6600 #ff9933",
             "border-color": "#000000",
             "border-width": "3px",
             "border-radius": "15px",
             "font-color": "#000",
             "font-size" : 16,
             "visible":1
             }
         }
     },
 "graphset" : [ .... normal chart JSON attributes here .... ]
Now you know what the "little black box with the question mark" is, and you know how to use it.