
This is a continuation article in a series of data visualization examples utilizing the JavaScript framework Vue.js, ZingChart, and ZingGrid. We highly recommend starting from the first article to follow along more easily.
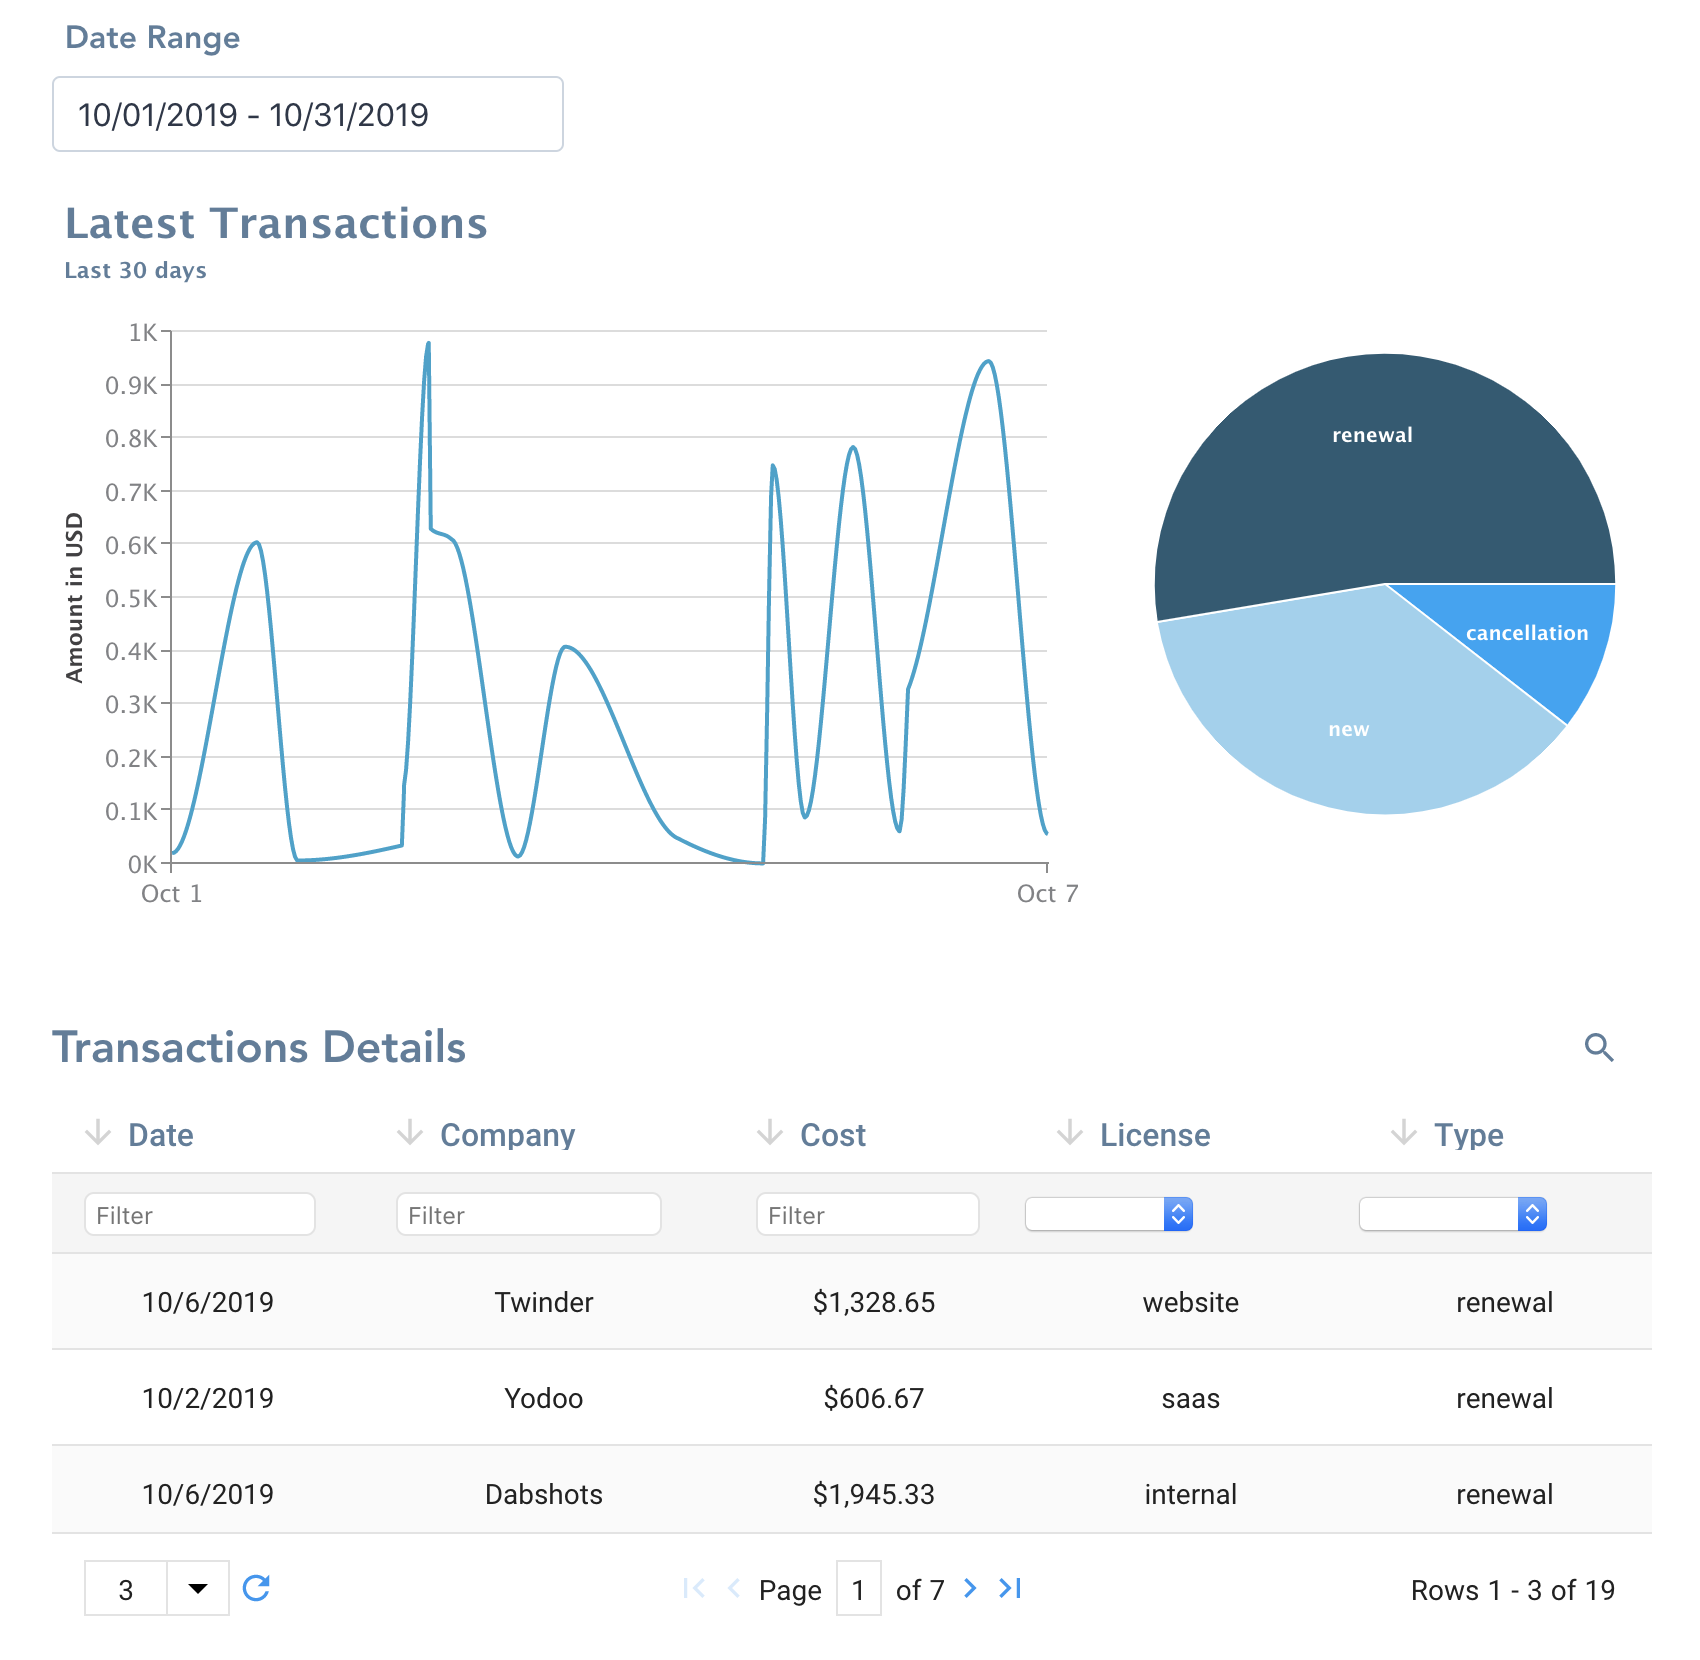
In our previous article, we walked through an example of how to create a data visualization dashboard with ZingChart and ZingGrid. We’re continuing this example by connecting our dashboard to real data, and handing the data management and fetching from the server to ZingGrid.
If you’d like to follow along, a finished example from our last article is the best place to start. You can grab that code from the GitHub repository under the part-2-complete branch: https://github.com/zingsoftinc/vue-dashboard
Creating a REST API for our dataset
We’ll start by creating a REST API server to host our transactions data. We recommend using json-server to quickly deploy endpoints in less than a minute flat!
First install the JSON server via NPM:
$ npm install -g json-server
We can then run the server directly from our transactions.json file with:
json-server --watch /path/tp/transactions.json
We can see if the endpoint is working by making a GET call to http://localhost:3000/transactionsto obtain a full list of our data.
Utilizing ZingGrid to manage the data
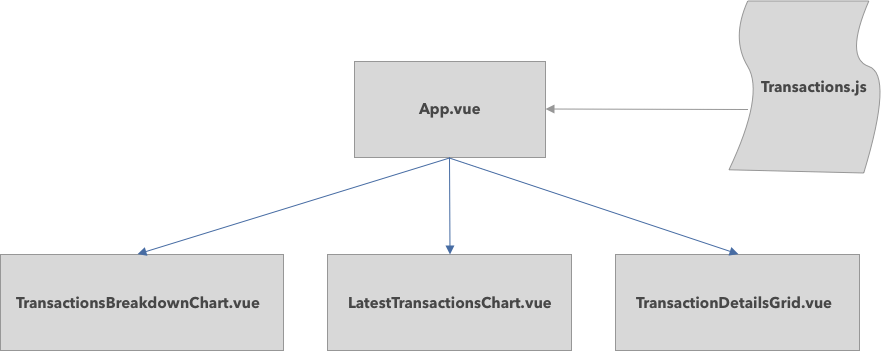
In the previous article of this series, we handled data flow from the App.vue down to each component, and obtained the data from a single file.
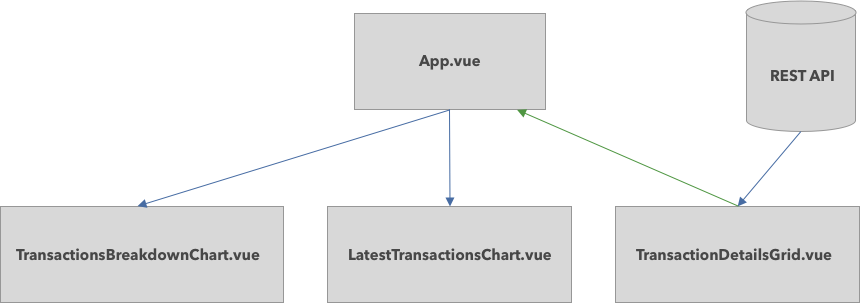
In this article, we’re utilizing ZingGrid’s REST API feature to obtain our dataset from a remote data source. We’ll then communicate the data to all other components on the page via the main parent App.vue.
Connecting ZingGrid to a remote data source
ZingGrid works out of the box with most REST API endpoints. We simply configure our data with zg-data and zg-param components.
<zg-data>
 <zg-param name="src" value="'http://localhost:3000/transactions"></zg-param>
 <zg-param name="searchKey" value="search"></zg-param>
 <zg-param name="loadByPage" value="true"></zg-param>
</zg-data>
Let’s breakdown each zg-param attribute:
src— the location of the REST API endpoint where our data resides.searchKey— when using the built-in search functionality on ZingGrid, we specify the query parameter needed to search in the REST API. In our example,json-serverhas the query parameter ofsearch.loadByPage— Load by page enables paginated queries on your REST API. This helps reduce the amount of data being transferred by only requesting what is in view. Suppose/transactionshas a total of 2000 entries, and ZingGrid has a paginated view of 10 entries. WithoutloadByPage, we would be downloading all 2000 entries initially, instead of the 10 that are just in view!
Connecting our calendar filter to ZingGrid
In order to utilize an external component to handle our data in conjunction with ZingGrid, we need to be a little creative.
First we pass the start and end dates from our calendar to ZingGrid in our App.vue file.
<v-date-picker mode="range" v-model="range"/>

<transaction-details-grid :start="range.start" :end="range.end" />
In our TransactionDetailsGrid, we create a new computed property queryString to reflect a query string with timestamp values, to be appended to our ZingGrid’s data component.
json-server has equality operations built in the REST API. For our calendar, we want to create a date range around each timestamp.
computed: {
queryString() {
return `timestamp_lte=${this.end.getTime()}×tamp_gte=${this.start.getTime()}`;
}
}Finally, we modify our src being passed to ZingGrid, and append our queryString value to it.
<zg-param name="src" :value="'http://localhost:3000/transactions?' + queryString"></zg-param>Now every time our calendar date-range is updated, ZingGrid re-fetches the data!
Connecting our charts to our data
We now need to connect the data obtained from ZingGrid to our charts.
We hook into ZingGrid’s event system to notify our Vue application when data changes, is filtered, or is searched upon.
We attach event listeners to ZingGrid, and pass a localized callback to emit an event back up to App.vue
const getData = () => {
  const data = this.$refs.myGrid.getData({
    rows: 'visible'
  });
  return this.$emit('ondatachange', data);
};

this.$refs.myGrid.addEventListener('data:load', getData);
this.$refs.myGrid.addEventListener('grid:search', getData);
this.$refs.myGrid.addEventListener('grid:filter', getData);
Back up in App.vue, we listen for the ondatachange in our TransactionDetailsGrid, and update our local transactionsdata.
<transaction-details-grid
 :start="range.start"
 :end="range.end"
 @mouseover="handleEntryHover"
 @ondatachange="updateData" />
updateData(data) {
 // We perform a copy of our data so we can modify it locally.
 this.transactions = JSON.parse(JSON.stringify(data));
},
Our dashboard should be fully functional, with our new remote dataset! Note that filtering and searching in ZingGrid also modify the state of the charts and what values are being represented. This allows for powerful data exploration with ZingGrid and ZingChart, with the ability to sift through large sets of data. You can view the finished product here: https://glitch.com/~vue-dashboard-live-data
That concludes our series for how to create a data visualization dashboard with Vue! If you’d like to see more Vue data visualization content, feel free to ask away in the comments!
A pioneer in the world of data visualization, ZingChart is a powerful JavaScript library built with big data in mind. With over 35 chart types and easy integration with your development stack, ZingChart allows you to create interactive and responsive charts with ease.