One of the interesting things we noticed in the preview of the ZingChart Canvas was an occasional assumption about feature density.
Take a look at the docs for a few seconds; we think you'll see more than a few chart types.
ZingChart Features
And even more interesting than chart variations, we have lots of features. This will be a quick post just to tickle your interest in only a few of features we think are interesting.
Rules
Styling data depending on value really only makes sense if you know what the data is before hand. While you could certainly code up some logic on the server to build a different chart depending on the data encountered, ZingChart provides simple rules that allow you to highlight items dynamically. Think about styling outliers, adding error bands, or just about any other idea and you'll see why rules make sense.
Zooming and Previews
You've probably seen it before in many libraries, but particularly with large datasets it is useful to enable zooming. With ZingChart we can do a preview window, right click menu, left click bounding box, or API call to zoom a chart as you like. Oh, and since we can easily handle large datasets, this can actually be less of a demo feature and more a valuable tool.

Live Data
Set up a feed and populate your chart with live data. You can even pause the data as it comes. If you are looking for an Ajax populated chart, this is about as easy as it gets.

Linked Data and Charts
Want to load some data, another chart or even a site when you interact with a graph? This is also really easy with ZingChart just set the url property. You can create parent child relationships between graphs, you can do a drill in, you can even send people to other sites, it's up to you. The library even supports a navigation system for a basic back, forward, and history management.

Styling, styling and more styling
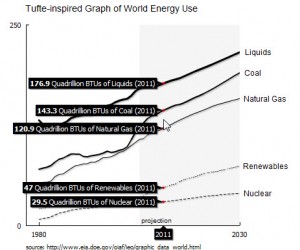
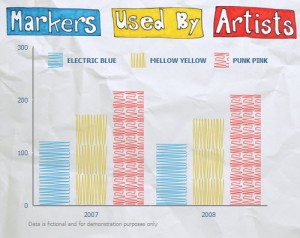
Tufte cover your ears, but some people get promotions for their chart junk. We try to help people build the infographics they want and need. Sure, we'd love to impose some sanity on their tiled backgrounds, ever present animation and 3D effects, clip-art galore, and crazy colors, but then again as we say around the office, "One person's chart junk is another person's pay raise." Of course, if you want to visit to the temple of Tufte, nothing in Zing will keep you from doing that.
However, if you want to go all out and add a few backgrounds and styles placed by a graphic designer, you must come out just fine too.
Anyway, ZingChart doesn't limit you when it comes to styling--do as you must.
Note: ZingChart is not liable for any retina damage caused by over the top chart design..read the EULA. Well not really, but who knows what's in these EULAs anymore.
We wrap up and point out that this post is itself just the briefest touch on some interesting features of ZingChart, explore the docs for more and if you see something missing you really need let us know, we'll probably add it.
--ZingChart Team