UPDATE
Our team’s constant improvements and additions to ZingChart are great for users looking for the largest selection of features and options. But sometimes it means our “how-to” blog posts could use a little updating.
In order to make our older and highly viewed how-to posts more helpful, we are updating the Beginner’s Guide series. Updates include the most recent version of the syntax, which makes it even easier to use the cool styling capabilities of ZingChart. Follow the new tutorial series if you're interested in getting a substantial overview of using the ZingChart library.
Welcome Back ZingCharters,
We will be continuing to work with the styling of our first chart. In this tutorial we will cover a variety of tips and tricks that will help you better represent your data. Just to review, we started with a very basic chart.
{
    "type":"bar",
    "series":[
        {
            "values":[48,44,14,32]
        },
        {
            "values":[22,36,15,37]
        }
    ]
}

In our first tutorial on Adding Chart Elements we showed you how to add different elements to your chart.
{
    "type":"bar",
       "title":{
           "text":"Chart Title"
       },
       "subtitle":{
           "text":"Our Subtitle"
       },
       "legend":{

       },
       "scale-x":{
           "values":["Quarter 1","Quarter 2","Quarter 3","Quarter 4"]
       },
       "scale-y":{
            "values":"0:100:20"
       },
       "series":[
           {
           "values":[48,44,14,32]
           },
           {
           "values":[22,36,15,37]
           }
    ]
}

In our last tutorial on Chart Styling Basics we covered how to style these elements and different ways you can change the look and feel of your chart.
{
    "type":"bar",
    "background-color":"#ccc",
    "title":{
        "text":"Chart Title",
        "background-color":"#555",
        "font-color":"#ccc"
    },
    "subtitle":{
        "text":"Our Subtitle"
    },
    "legend":{
        "border-width":0,
        "shadow":0,
        "alpha":1,
        "item":{
            "color":"red"
        }
    },
    "scale-x":{
        "values":["Quarter 1","Quarter 2","Quarter 3","Quarter 4"],
        "item":{
            "color":"#fff"
        }
    },
    "scale-y":{
        "values":"0:100:20"
    },
    "plotarea":{
        "background-color":"#fff"
    },
    "series":[
        {
        "values":[48,44,14,32],
            "text":"Products",
            "background-color":"#6135be"
        },
        {
        "values":[22,36,15,37],
            "text":"Service",
            "background-color":"#8668e2"
        }
    ]
}
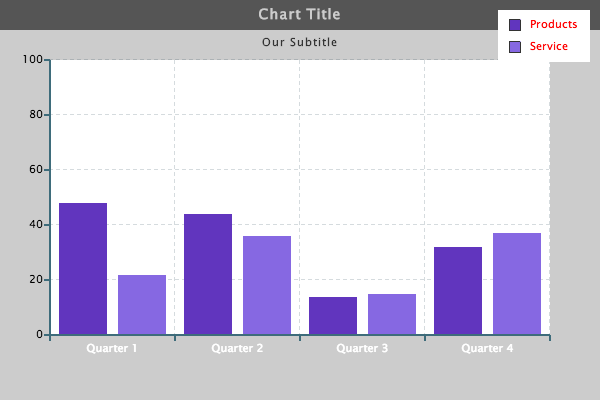
In this tutorial, Chart Styling Basics 2, we will continue to cover how to style the different elements in this chart. Plus, we will show you a few neat tricks you will certainly find useful.
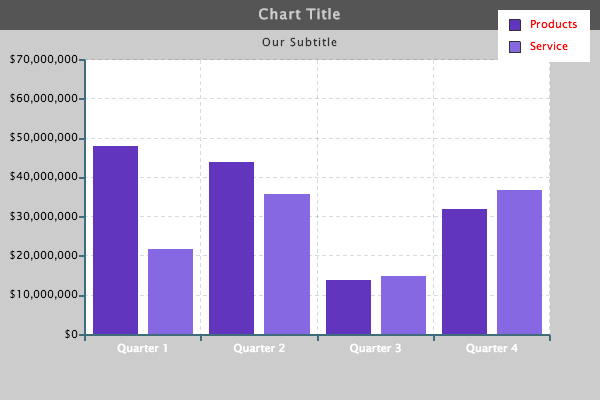
At this point, we have changed the look of the chart but we have not done much to properly represent the data that we have. To start this tutorial, we are first going to change the data. We are going to use larger numbers to help show some of the situations you might encounter with you own charts.
In this chart we have changed the data into millions. As you can see, we have come across a problem.
{
    "type":"bar",
    "background-color":"#ccc",
    "title":{
        "text":"Chart Title",
        "background-color":"#555",
        "font-color":"#ccc"
    },
    "subtitle":{
        "text":"Our Subtitle"
    },
    "legend":{
        "border-width":0,
        "shadow":0,
        "alpha":1,
        "item":{
            "color":"red"
        }
    },
    "scale-x":{
        "values":["Quarter 1","Quarter 2","Quarter 3","Quarter 4"],
        "item":{
            "color":"#fff"
        }
    },
    "scale-y":{
        "values":"0:100:20"
    },
    "plotarea":{
        "background-color":"#fff"
    },
    "series":[
        {
        "values":[48000000,44000000,14000000,32000000],
            "text":"Products",
            "background-color":"#6135be"
        },
        {
        "values":[22000000,36000000,15000000,37000000],
            "text":"Service",
            "background-color":"#8668e2"
        }
    ]
}

Scale
The first thing we need to remember is that in our first tutorial we showed you how to set the "scale-y":{ }, object values. The values we set before do not work with our new data.
First things first: we need to adjust our scale to fit the new higher values.
{
    "type":"bar",
    "background-color":"#ccc",
    "title":{
        "text":"Chart Title",
        "background-color":"#555",
        "font-color":"#ccc"
    },
    "subtitle":{
        "text":"Our Subtitle"
    },
    "legend":{
        "border-width":0,
        "shadow":0,
        "alpha":1,
        "item":{
            "color":"red"
        }
    },
    "scale-x":{
        "values":["Quarter 1","Quarter 2","Quarter 3","Quarter 4"],
        "item":{
            "color":"#fff"
        }
    },
    "scale-y":{
        "values":"0:75000000:10000000"
    },
    "plotarea":{
        "background-color":"#fff"
    },
    "series":[
        {
        "values":[48000000,44000000,14000000,32000000],
            "text":"Products",
            "background-color":"#6135be"
        },
        {
        "values":[22000000,36000000,15000000,37000000],
            "text":"Service",
            "background-color":"#8668e2"
        }
    ]
}

Margin
Now you can see we have fixed the problem of our plot nodes extending past the top of our chart. However, we have encountered a new problem. Now our y-axis values do not fit on the chart.
In this situation, we have a few different ways to deal with the problem. First, we will assume having the entire number visible is important to your chart. We will work with margins to allow all of the chart information to fit.
Below we have added the attribute "margin-left": to the "plotarea":{ }, object to give "plotarea":{ }, a larger margin on the left to accommodate the larger values.
{
    "type":"bar",
    "background-color":"#ccc",
    "title":{
        "text":"Chart Title",
        "background-color":"#555",
        "font-color":"#ccc"
    },
    "subtitle":{
        "text":"Our Subtitle"
    },
    "legend":{
        "border-width":0,
        "shadow":0,
        "alpha":1,
        "item":{
            "color":"red"
        }
    },
    "scale-x":{
        "values":["Quarter 1","Quarter 2","Quarter 3","Quarter 4"],
        "item":{
            "color":"#fff"
        }
    },
    "scale-y":{
        "values":"0:75000000:10000000"
    },
    "plotarea":{
        "background-color":"#fff",
        "margin-left":"85px"
    },
    "series":[
        {
        "values":[48000000,44000000,14000000,32000000],
        "text":"Products",
        "background-color":"#6135be"
        },
        {
        "values":[22000000,36000000,15000000,37000000],
        "text":"Service",
        "background-color":"#8668e2"
        }
    ]
}

Our margin attribute works just like the margin attribute in CSS. Therefore, you could also use a format similar to this:
{
    "type":"bar",
    "background-color":"#ccc",
    "title":{
        "text":"Chart Title",
        "background-color":"#555",
        "font-color":"#ccc"
    },
    "subtitle":{
        "text":"Our Subtitle"
    },
    "legend":{
        "border-width":0,
        "shadow":0,
        "alpha":1,
        "item":{
            "color":"red"
        }
    },
    "scale-x":{
        "values":["Quarter 1","Quarter 2","Quarter 3","Quarter 4"],
        "item":{
            "color":"#fff"
        }
    },
    "scale-y":{
        "values":"0:75000000:10000000"
    },
    "plotarea":{
        "background-color":"#fff",
        "margin":"65 45 65 85"
    },
    "series":[
        {
        "values":[48000000,44000000,14000000,32000000],
        "text":"Products",
        "background-color":"#6135be"
        },
        {
        "values":[22000000,36000000,15000000,37000000],
        "text":"Service",
        "background-color":"#8668e2"
        }
    ]
}
For more information on different ways to format your margins and padding you can visit our Online Reference.
Scale Y
Now all of the numbers fit properly on our chart. However, with all of those zeroes, the values are hard to read. Also, there is nothing showing users what the large numbers represent.
Here we add two attributes to our "scale-y":{ }, object. This first is "thousands-separator":" " which allows us to separate large numbers with a comma or a period.
Also, we add "format": this will allow us to format the values on the y-axis.
{
    "type":"bar",
    "background-color":"#ccc",
    "title":{
        "text":"Chart Title",
        "background-color":"#555",
        "font-color":"#ccc"
    },
    "subtitle":{
        "text":"Our Subtitle"
    },
    "legend":{
        "border-width":0,
        "shadow":0,
        "alpha":1,
        "item":{
            "color":"red"
        }
    },
    "scale-x":{
        "values":["Quarter 1","Quarter 2","Quarter 3","Quarter 4"],
        "item":{
            "color":"#fff"
        }
    },
    "scale-y":{
        "values":"0:75000000:10000000",
        "thousands-separator":",",
        "format":"$%v"
    },
    "plotarea":{
        "background-color":"#fff",
        "margin-left":"85px"
    },
    "series":[
        {
        "values":[48000000,44000000,14000000,32000000],
        "text":"Products",
        "background-color":"#6135be"
        },
        {
        "values":[22000000,36000000,15000000,37000000],
        "text":"Service",
        "background-color":"#8668e2"
        }
    ]
}
You will see the value in "format":" " being represented by %v. This is common throughout ZingChart. This is part of our tokens. There are a variety of tokens you can use, or you can create your own. Take a look at details about tokens in our docs or you can see a list of tokens in this Zingers post.
However, I did say there were multiple ways to deal with the large numbers. One option is to use margins. The other option is to use our "multiplier": attribute.
{
    "type":"bar",
    "background-color":"#ccc",
    "title":{
        "text":"Chart Title",
        "background-color":"#555",
        "font-color":"#ccc"
    },
    "subtitle":{
        "text":"Our Subtitle"
    },
    "legend":{
        "border-width":0,
        "shadow":0,
        "alpha":1,
        "item":{
            "color":"red"
        }
    },
    "scale-x":{
        "values":["Quarter 1","Quarter 2","Quarter 3","Quarter 4"],
        "item":{
            "color":"#fff"
        }
    },
    "scale-y":{
        "values":"0:75000000:10000000",
        "format":"$%v",
        "multiplier":true
    },
    "plotarea":{
        "background-color":"#fff"
    },
    "series":[
        {
        "values":[48000000,44000000,14000000,32000000],
        "text":"Products",
        "background-color":"#6135be"
        },
        {
        "values":[22000000,36000000,15000000,37000000],
        "text":"Service",
        "background-color":"#8668e2"
        }
    ]
}

By adding in this multiplier, ZingChart will automatically reduce the digits into an abbreviated form. This makes numbers easier to read, and it saves you a lot of space.
You will also notice I removed a few attributes from the code. This is because they were no longer needed once I used the "multiplier":true attribute. You could leave these attributes in the code without really affecting the chart, but they are not needed. The margin would stay and give additional space, but I chose to remove it. The "thousands-separator": would currently not affect anything if it was left in.
I removed "margin-left": from "plotarea":{ },
I removed "thousands-separator":",", from "scale-y":{ },
Guide
Alright, things are starting to shape up. There are still some things on the chart that need improvement. I am going to remove the vertical guides on the chart and style the horizontal ones to clean things up.
{
    "type":"bar",
    "background-color":"#ccc",
    "title":{
        "text":"Chart Title",
        "background-color":"#555",
        "font-color":"#ccc"
    },
    "subtitle":{
        "text":"Our Subtitle"
    },
    "legend":{
        "border-width":0,
        "shadow":0,
        "alpha":1,
        "item":{
            "color":"red"
        }
    },
    "scale-x":{
        "values":["Quarter 1","Quarter 2","Quarter 3","Quarter 4"],
        "item":{
            "color":"#fff"
        },
        "guide":{
            "visible":false
        }
    },
    "scale-y":{
        "values":"0:75000000:10000000",
        "format":"$%v",
        "multiplier":true
    },
    "plotarea":{
        "background-color":"#fff"
    },
    "series":[
        {
        "values":[48000000,44000000,14000000,32000000],
        "text":"Products",
        "background-color":"#6135be"
        },
        {
        "values":[22000000,36000000,15000000,37000000],
        "text":"Service",
        "background-color":"#8668e2"
        }
    ]
}

I added the "guide":{ }, object within the "scale-x":{ }, object. This will allow me to manipulate the "guide":{ }, but only in reference to that specific object. Then by adding the attribute "visible":false I was able to hide the vertical guide.
Now, if I add the "guide":{ }, object to the "scale-y":{ }, object, I can manipulate that guide to look the way I want.
{
    "type":"bar",
    "background-color":"#ccc",
    "title":{
        "text":"Chart Title",
        "background-color":"#555",
        "font-color":"#ccc"
    },
    "subtitle":{
        "text":"Our Subtitle"
    },
    "legend":{
        "border-width":0,
        "shadow":0,
        "alpha":1,
        "item":{
            "color":"red"
        }
    },
    "scale-x":{
        "values":["Quarter 1","Quarter 2","Quarter 3","Quarter 4"],
        "item":{
            "color":"#fff"
        },
        "guide":{
            "visible":false
        }
    },
    "scale-y":{
        "values":"0:75000000:10000000",
        "format":"$%v",
        "multiplier":true,
        "line-color":"red",
        "guide":{
            "line-color":"#555",
            "line-style":"dotted",
            "line-width":"2px"
        }
    },
    "plotarea":{
        "background-color":"#fff"
    },
    "series":[
        {
        "values":[48000000,44000000,14000000,32000000],
        "text":"Products",
        "background-color":"#6135be"
        },
        {
        "values":[22000000,36000000,15000000,37000000],
        "text":"Service",
        "background-color":"#8668e2"
        }
    ]
}

As you can see I added a few styling attributes to the "guide":{ } object that is inside of the "scale-y":{ }, object and transformed the look of the chart. This is another example of how an object can be used in multiple places to generate specific results. ZingChart does provide you the ability to really take control of your charts.
X and Y Axis
Finally, let's dress up the x and y axis lines before we move to our next tutorial.
First thing we are going to do is change the color and the thickness of the axis lines. This is done by simply adding styling attributes to the "scale-x":{ }, and "scale-y":{ }, objects.
{
    "type":"bar",
    "background-color":"#ccc",
    "title":{
        "text":"Chart Title",
        "background-color":"#555",
        "font-color":"#ccc"
    },
    "subtitle":{
        "text":"Our Subtitle"
    },
    "legend":{
        "border-width":0,
        "shadow":0,
        "alpha":1,
        "item":{
            "color":"red"
        }
    },
    "scale-x":{
        "values":["Quarter 1","Quarter 2","Quarter 3","Quarter 4"],
        "line-color":"#555",
        "line-width":"4px",
        "item":{
            "color":"#fff"
        },
        "guide":{
            "visible":false
        }
    },
    "scale-y":{
        "values":"0:75000000:10000000",
        "format":"$%v",
        "multiplier":true,
        "line-color":"#555",
        "line-width":"4px",
        "guide":{
            "line-color":"#555",
            "line-style":"dotted",
            "line-width":"2px"
        }
    },
    "plotarea":{
        "background-color":"#fff"
    },
    "series":[
        {
        "values":[48000000,44000000,14000000,32000000],
        "text":"Products",
        "background-color":"#6135be"
        },
        {
        "values":[22000000,36000000,15000000,37000000],
        "text":"Service",
        "background-color":"#8668e2"
        }
    ]
}

Now we can really change the look of the axes by manipulating the ticks. First we will change the ticks on "scale-x":{ }, Again, we do this by adding a "tick":{ }, object and some styling attributes.
{
    "type":"bar",
    "background-color":"#ccc",
    "title":{
        "text":"Chart Title",
        "background-color":"#555",
        "font-color":"#ccc"
    },
    "subtitle":{
        "text":"Our Subtitle"
    },
    "legend":{
        "border-width":0,
        "shadow":0,
        "alpha":1,
        "item":{
            "color":"red"
        }
    },
    "scale-x":{
        "values":["Quarter 1","Quarter 2","Quarter 3","Quarter 4"],
        "line-color":"#555",
        "line-width":"4px",
        "item":{
            "color":"white"
        },
        "guide":{
            "visible":false
        },
        "tick":{
            "size":10,
            "line-width":3,
            "line-color":"#555",
            "placement":"outer"
        }
    },
    "scale-y":{
        "values":"0:75000000:10000000",
        "format":"$%v",
        "multiplier":true,
        "line-color":"#555",
        "line-width":"4px",
        "guide":{
            "line-color":"#555",
            "line-style":"dotted",
            "line-width":"2px"
        }
    },
    "plotarea":{
        "background-color":"#fff"
    },
    "series":[
        {
        "values":[48000000,44000000,14000000,32000000],
        "text":"Products",
        "background-color":"#6135be"
        },
        {
        "values":[22000000,36000000,15000000,37000000],
        "text":"Service",
        "background-color":"#8668e2"
        }
    ]
}

Now we will want to do the same thing in "scale-y:{ },
{
    "type":"bar",
    "background-color":"#ccc",
    "title":{
        "text":"Chart Title",
        "background-color":"#555",
        "font-color":"#ccc"
    },
    "subtitle":{
        "text":"Our Subtitle"
    },
    "legend":{
        "border-width":0,
        "shadow":0,
        "alpha":1,
        "item":{
            "color":"red"
        }
    },
    "scale-x":{
        "values":["Quarter 1","Quarter 2","Quarter 3","Quarter 4"],
        "line-color":"#555",
        "line-width":"4px",
        "item":{
            "color":"white"
        },
        "guide":{
            "visible":false
        },
        "tick":{
            "size":10,
            "line-width":3,
            "line-color":"#555",
            "placement":"outer"
        }
    },
    "scale-y":{
        "values":"0:75000000:10000000",
        "format":"$%v",
        "multiplier":true,
        "line-color":"#555",
        "line-width":"4px",
        "guide":{
            "line-color":"#555",
            "line-style":"dotted",
            "line-width":"2px"
        },
         "tick":{
            "size":10,
            "line-width":3,
            "line-color":"#555",
            "placement":"outer"
        }
    },
    "plotarea":{
        "background-color":"#fff"
    },
    "series":[
        {
        "values":[48000000,44000000,14000000,32000000],
        "text":"Products",
        "background-color":"#6135be"
        },
        {
        "values":[22000000,36000000,15000000,37000000],
        "text":"Service",
        "background-color":"#8668e2"
        }
    ]
}

You might notice that the y axis scale values are a little cramped. This can easily be fixed with padding. We add in the "item":{ }, object within the "scale-y":{ }, object and then we can utilize the "padding":" " attribute.
{
    "type":"bar",
    "background-color":"#ccc",
    "title":{
        "text":"Chart Title",
        "background-color":"#555",
        "font-color":"#ccc"
    },
    "subtitle":{
        "text":"Our Subtitle"
    },
    "legend":{
        "border-width":0,
        "shadow":0,
        "alpha":1,
        "item":{
            "color":"red"
        }
    },
    "scale-x":{
        "values":["Quarter 1","Quarter 2","Quarter 3","Quarter 4"],
        "line-color":"#555",
        "line-width":"4px",
        "item":{
            "color":"white"
        },
        "guide":{
            "visible":false
        },
        "tick":{
            "size":10,
            "line-width":3,
            "line-color":"#555",
            "placement":"outer"
        }
    },
    "scale-y":{
        "values":"0:75000000:10000000",
        "format":"$%v",
        "multiplier":true,
        "line-color":"#555",
        "line-width":"4px",
        "guide":{
            "line-color":"#555",
            "line-style":"dotted",
            "line-width":"2px"
        },
         "tick":{
            "size":10,
            "line-width":3,
            "line-color":"#555",
            "placement":"outer"
        },
        "item":{
            "padding":"5px"
        }
    },
    "plotarea":{
        "background-color":"#fff"
    },
    "series":[
        {
        "values":[48000000,44000000,14000000,32000000],
        "text":"Products",
        "background-color":"#6135be"
        },
        {
        "values":[22000000,36000000,15000000,37000000],
        "text":"Service",
        "background-color":"#8668e2"
        }
    ]
}

This makes our x and y axes more predominate and easier to see. There are many different attributes you can use to style the x or y axis. Take a look at some of our docs and see what other attributes you can use to design your charts.
In our next tutorial, Chart Styling : Part 3, we will help tie everything in the chart together for a nice, polished look.
Happy Charting,
ZingChart Team