This tutorial will show you how to create your own version of our ZingChart-Firebase demo. In this web app, data is pulled from a Firebase Realtime database and then visualized on a ZingChart. User interactions with this ZingChart are displayed visually through SVG manipulation.
We will not cover setting up a Firebase database in depth. For more information on getting started with Firebase, please see Firebase's platform-specific guides.
Firebase Rules
In order to access data from a Firebase database, you need to ensure that your website is allowed to read data. To change the database's rules, you simply go to the database page on your project's console and click on the tab which reads "Rules."
We wanted our database to be readable by any user, but wanted to limit those able to write to the database to only authorized service accounts. Keeping these permissions in mind, we replaced the default rules with the following.
{
    "rules": {
        ".read": true,
        ".write": "auth != null"
    }
}
For more information on permissions, check out Firebase's guide to understanding rules.
Initializing Firebase and ZingChart
Now that our webpage has the ability to access our Firebase Database, we need to initialize Firebase and ZingChart. This is done by adding the following scripts to our HTML document's head.
<script src="https://cdn.zingchart.com/2.3.3/zingchart.min.js"></script> <!-- The ZingChart Library -->
<script src="https://www.gstatic.com/firebasejs/3.1.0/firebase.js"></script> <!-- The Firebase Library -->
<script>
    // Initialize Firebase
    var config = {
        apiKey: "apiKeySAMPLE", //Replace me!
        authDomain: "projectIdSAMPLE.firebaseapp.com", //Replace me!
        databaseURL: "https://databaseNameSAMPLE.firebaseio.com", //Replace me!
        storageBucket: "bucketSAMPLE.appspot.com", //Replace me!
    };
    firebase.initializeApp(config);
</script>
Replace the config values above with your own project's values, which can be found by clicking the "Add Firebase to your web app" button on your project's overview page.
Alternatively, you can try this tutorial out with our Firebase Database, whose config is below.
<script>
  // Initialize Firebase
  var config = {
    apiKey: "AIzaSyAoODNh3wDCM0brDULDBJK6vHqOWplc1W8",
    authDomain: "zing-chart-firebase-demo.firebaseapp.com",
    databaseURL: "https://zing-chart-firebase-demo.firebaseio.com",
    storageBucket: "zing-chart-firebase-demo.appspot.com",
  };
  firebase.initializeApp(config);
</script>
To have full Firebase functionality, you will need to set up a local server for development. We used the Firebase CLI, which can be installed as below.
$ npm install -g firebase-tools
$ firebase serve
We are now ready to begin using Firebase and ZingChart!
Referencing Firebase Data
For our demo, we used oceanographic data from CDIP, which we stored in the following fashion:
━ Database
    ┗━ STATION NUMBER //Corresponding to a particular CDIP Buoy
        ┗━ KEY //Generated by Firebase on input
            ┣━ Direction: DIRECTION
            ┣━ Height: HEIGHT
            ┣━ Period: Period
            ┗━ unixtime: UNIXTIME
We can begin to get information from Firebase by creating a function to take a snapshot of our data. The station whose data we wish to access, Torrey Pines Outer, is named 100. Given our data's structure, we created getstationDetails.
function getstationDetails(callbackIN)
{
    var stationRef = firebase.database().ref("100");
    stationRef.once('value').then(function(snapshot) {
        callbackIN(snapshot.val())
    });
}
We can now access the objects associated with station 100 in whatever function we pass to getStationDetails. This passed function will handle the bulk of our ZingChart code. To check and make sure our snapshot worked correctly, we add the following to our code:
window.addEventListener("load", getstationDetails(function(snap){
    return console.log(snap);
}));
If you serve your page and check out the JavaScript console, you should see an object comprised of keys mapping to the data stored under station number "100" (or anything you replace that with) in your database. These keys are chronologically ordered, which helps for organizing our data.
We've now successfully extracted our data from Firebase! Now we can begin the process of creating our ZingChart.
Creating our ZingChart
In the last section, we passed a callback function to getstationDetails. In this section, we will write a function called callbackfxn, which will take in our Firebase object, and turn it into an array of objects called stationDetails:
function callbackfxn(snap) {
    var stationDetails = [];
    for (var key in snap) {
        // skip loop if the property is from prototype
        if (!snap.hasOwnProperty(key)) continue;
        var obj = snap[key];
        stationDetails.push(obj);
    }
//(...)
Next we want to iterate through stationDetails and store our data in specific arrays related to their use. Since we are using two data series to plot our graph, we need to create a two dimensional array, chartValues, to store time and wave height values in. We also need to create a one dimensional array, arrowsArray, to store the JSON for each data point we have.
After we've created the variables, we want to iterate through stationDetails and push the relevant values onto our arrays. For chartValues, we want to push the unixtime and Height values for each object in stationDetails. For arrowsArray, we want to push the JSON code determining the styling, position, length, etc.
In this demo, we chose the length of the arrow to represent the period of the waves and the rotation of the arrows to represent the direction of the waves. For more information, check out the ZingChart docs for arrows and plot/series
//(continued)
    var stationDetails = [];
    var arrowsArray = [];
    for (var i = 0; i < stationDetails.length; i++) {
        chartValues.push([(stationDetails[i]["unixtime"] - (3600000 * 7)), stationDetails[i]["Height"] * 3.28084]); //Here we also convert height from meters to feet
        arrowsArray.push({
            backgroundColor: "#224264",
            borderColor: "#224264",
            length: stationDetails[i]["Period"] * 3, //length of arrow
            direction: "bottom",
            from: {
                hook: "node:plot=0,index=" + i
            },
            angle: stationDetails[i]["Direction"]+180
        })
    }
//(...)
Now that we have access to the data in a format that ZingChart can understand, we can create our graph!
//(continued)

    zingchart.render({
        id: "waveHeight",
        width: "100%",
        height: "100%",
        data: {
            "background-color": "#eef3f9",
            "type": "area",
            "arrows": arrowsArray,
            "title": {
                "text": "Wave Heights over time",
                "color": "#1d3955"
            },
            "chart": {
                "background-color": "#eef3f9"
            },
            "plot": {
                "line-color": "#00baf0",
                "font-color": "#1d3955",
                "line-width": 3,
                "aspect": "spline",
                "marker": {
                    "visible": false
                }
            },
            "series": [
                {
                    "values": chartValues
                }
            ],
            "scale-x": {
                "transform": {
                    "all": "%m/%d %h:%i %A",
                    'type': "date",
                    "color": "#1d3955"
                },
                "label": {
                    "text": "Time (UTC)",
                    "color": "#1d3955"
                },
                "line-color": "#1d3955",
                "line-width": 1.5,
                "tick":{
                    "line-color":"#1d3955",
                    "line-width":2,
                    "line-style":"solid",
                    "size":12,
                    "placement":"cross"
                },
                "item":{
                    "font-color":"#1d3955",
                    "font-size":12,
                    "font-weight":"bold"
                }

            },
            "scale-y": {
                "color": "#1d3955",
                "label": {
                    "text": "Wave Height (ft)",
                    "color": "#1d3955"
                },
                "line-color": "#1d3955",
                "line-width": 1.5,
                "tick":{
                    "line-color":"#1d3955",
                    "line-width":2,
                    "line-style":"solid",
                    "size":12,
                    "placement":"cross"
                },
                "guide": {
                    "line-color":"#607488",
                    "line-width":1,
                    "line-style":"dashed"
                },
                "item":{
                    "font-color":"#1d3955",
                    "font-size":12,
                    "font-weight":"bold"
                }
            },
            "crosshair-x":{
                "plot-label":{
                    "visible":0
                },
                "scale-label":{
                    "visible":0
                }
            }
        }
    });
}
We simply include "arrows":arrowsArray in our ZingChart data object to display arrows, and set series's attributes to include "values": chartValues. This is the final step necessary to display the data we've pulled from our Firebase Database.
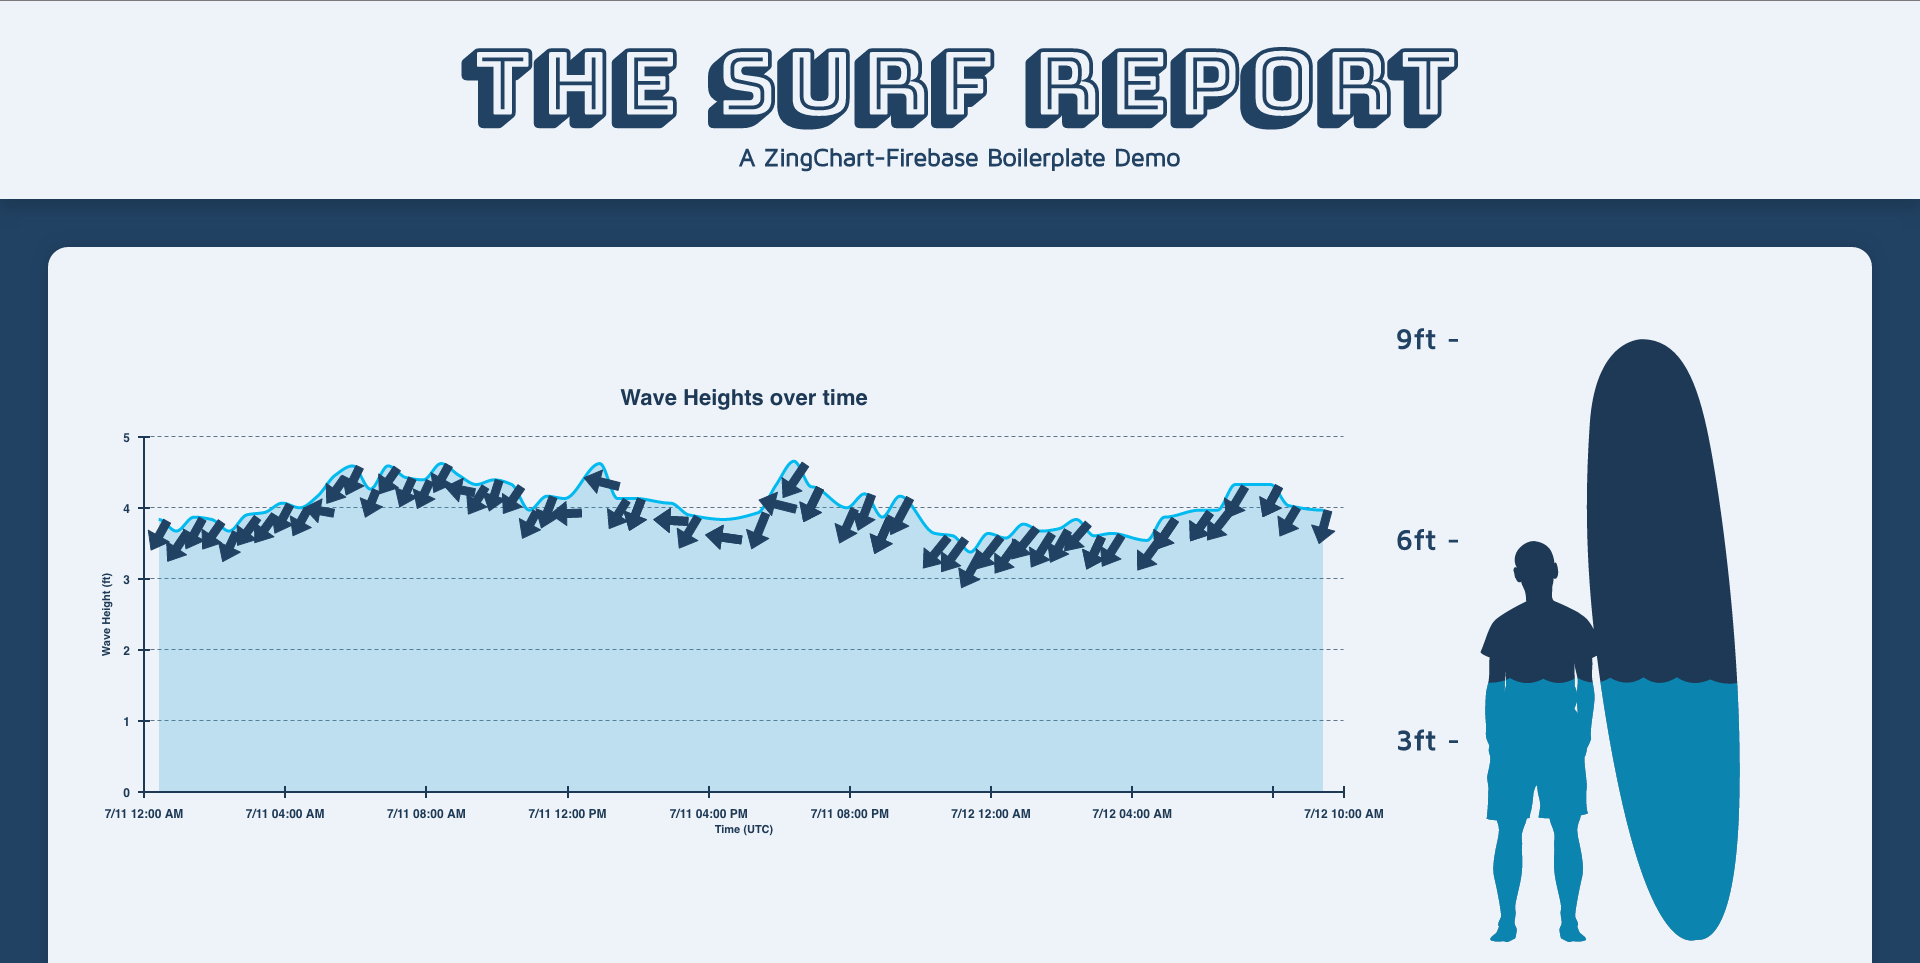
An Introduction to Snap.svg
To add a little more user engagement to the page, we're going to manipulate an SVG image based on the wave height data we've gathered from our Firebase Database. The SVG image we'll be adjusting, with "id = person", is comprised of three paths and some text. We'll be using the paths with the ids "top" and "waterLevel".
Path "top" is a path in the shape of a person with a surf board. Path "waterLevel" is a shape with corners initially at the upper corners of the dimensions of path "top" and eight bezier curve segments, which we'll manipulate to look like moving water. We will mask path "top" with path "waterLevel".
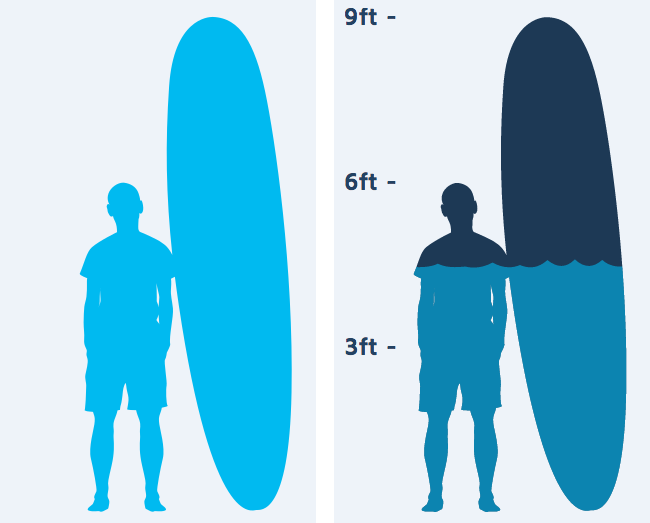
In the image above, you can see the effect of this masking. On the left is simply the path "top", and on the right is the final SVG image (in use) with path "top" masked by path "waterLevel". You can find the full SVG image here.
We will use the JavaScript Library Snap.svg to control our animations, so be sure to include their script in your HTML head. We'll start out by setting up the masking. The following code triggers on load and creates a drawing surface using our SVG object "person".
We then select the paths "waterLevel" and "top" from this drawing surface and assign them to variables. we now can use Snap.svg's Element.attr(...) function to mask path "top" with path "waterLevel".
document.getElementById("person").onload = function () {
    var personImage = Snap("#person");
    var waterLevel = personImage.select("#waterLevel");
    var top = personImage.select("#top");
    top.attr({
        mask: waterLevel
    });
};
Now that we've got the basics of Snap.svg down, let's integrate it with ZingChart.
Using ZingChart's API Events
The final part of this tutorial focuses on creating an interactive SVG image of a surfer with a display indicating the wave height in respect to him and his surf board at the position of the user's crosshair. This is done using data from ZingChart's guide_mousemove API event. This event is triggered by a change in the crosshair position. To read more about the usage of this event, check out our reference and demo here.
The following code initializes our drawing surface, a reference to the path "waterLevel", and a variable "num" to contain the current height data to be displayed. This code should be appended to the end of callbackfxn (written above).
//(continued from callbackfxn)
    var personImage = Snap("#person");
    var waterLevel = personImage.select("#waterLevel");
    num = 0;
//(...)
In order make our image interactive, we need to access the data relating to the point which the crosshair is over. To do this, we write the following code, which is dispatched when the crosshair position changes. The variable p contains data relating to the graph itself and the data the crosshair is positioned over. We can access the height of the wave by referencing p["items"][0]["value"].
If this value is a number, we set num = p["items"][0]["value"]. In the case that this is not a number, we simply set num = chartValues[chartValues.length-1][1], making num simply the most recent height value of the data pulled from our Firebase Database.
    zingchart.guide_mousemove = function(p) {
        if (isNaN(p["items"][0]["value"]) == false)
        {
            num = p["items"][0]["value"];
        }
        else
        {
            num = chartValues[chartValues.length-1][1];
        }
    };
We now want to define a function called animationLoop, which animates the top segments of the path "waterLevel". Since the curves we have are cubic bezier curves, we have to change the y position of three points for every segment: the first control point, the second control point and the end point. This is accomplished by taking the height (scale is 90 px per 'foot') and adjusting it by a random number (for control points one and two, this random number is between 0 and -3; for the end point, this number is between 0 and 15).
This random variation allows for a natural variation in wave heights, or the end points. These points are then compiled into a path and animated using the Element.animate(...) function over 0.7 seconds. It may look intimidating, but it's actually just a lot of repetition!
/*
Cubic Bezier Curve Format:
(...)
+ control point one string
+ control point two string
+ endpoint string
(...)
*/
//(continued)
    function animationLoop(height) {
        waterLevel.animate({
            d:"M 0,"+ (820 - (height * 90 + Math.random()*(15))).toString()
               + " C 0," + (820- (height * 90 - Math.random()*(3))).toString()
               + " 30," + (820- (height * 90 - Math.random()*(3))).toString()
               + " 45,"+ (820 - (height * 90 + Math.random()*(15))).toString()

               + " 60," + (820- (height * 90 - Math.random()*(3))).toString()
               + " 75," + (820- (height * 90 - Math.random()*(3))).toString()
               + " 90,"+ (820 - (height * 90 + Math.random()*(15))).toString()

               + " 105," + (820- (height * 90 - Math.random()*(3))).toString()
               + " 120," + (820- (height * 90 - Math.random()*(3))).toString()
               + " 135,"+ (820 - (height*90 + Math.random()*(15))).toString()

               + " 150," + (820- (height * 90 - Math.random()*(3))).toString()
               + " 165," + (820- (height * 90 - Math.random()*(3))).toString()
               + " 180,"+ (820 - (height * 90 + Math.random()*(15))).toString()

               + " 195," + (820- (height * 90 - Math.random()*(3))).toString()
               + " 210," + (820- (height * 90 - Math.random()*(3))).toString()
               + " 225,"+ (820 - (height * 90 + Math.random()*(15))).toString()

               + " 240," + (820- (height * 90 - Math.random()*(3))).toString()
               + " 255," + (820- (height * 90 - Math.random()*(3))).toString()
               + " 270,"+ (820 - (height * 90 + Math.random()*(15))).toString()

               + " 285," + (820- (height * 90 - Math.random()*(3))).toString()
               + " 300," + (820- (height * 90 - Math.random()*(3))).toString()
               + " 315," + (820 - (height * 90 + Math.random()*(15))).toString()

               + " 330,"+ (820- (height * 90 - Math.random()*(3))).toString()
               + " 360,"+ (821.5- (height * 90 - Math.random()*(3))).toString()
               + " 360,"+ (820 - (height * 90 + Math.random()*(15))).toString()

               + " L 360,820 0,820 Z"
        }, 700);
    }
\\(...)
Now that we have our animation all set up, we want to initialize our loop. This is done using the setInterval function with a 0.7 second delay, which runs our function animationLoop(num).
    var loop = setInterval(function () {
        animationLoop(num);
    },700);
}
All the above code and more are available on GitHub.
Feel free to submit any pull requests you find with this demo. We are eager to see what you come up with, so please share it with us!