Real time charts are more important than ever in today's big data world. Users want to see the absolute latest numbers. To help you accommodate these users, ZingChart offers multiple solutions for building real-time data charts.
Transporting real-time data
Transporting data from your server to the client is usually done using a simple HTTP. You can do this by:
-
Writing a server-side program
-
Setting a file on your server to connect with your chart values.
Then, you configure the refresh object in ZingChart to fetch this data as often as you like.
Websockets

Are you building scalable, event-driven, real-time data charts in your web applications? You may want to consider transporting your data via Websockets.
The persistent connection they create provides the two-way communication that is needed to ensure charts stay up to date. ZingChart has built-in Websocket support: just set an endpoint, and low latency updates are ready to go.
Custom JavaScript

You can always write your own JavaScript and use our rich API to update your charts. This will rely on a custom JS function, your own Ajax calls for passing data, and the ability to modify the data before it renders to the chart.
Which real-time data transport method should I choose?

If your data is already formatted and your charts will be simple, HTTP is the easiest option. Does your server have the ability to hook up to Websockets? Then you may find that to be faster than the basic HTTP.
If you need to format your data, or if you need to modify your requests for data, you’ll need to choose either HTTP or Websockets, and apply custom JavaScript on top.
Real-time data update intervals

Real-time data is updated in different intervals, from milliseconds, to minutes, and even to hours. You can customize the update interval to suit your data to not only improve performance, but free up network resources.
Feed intervals are set using the “interval” attribute of the “refresh” chart object. Values less than 50 will be measured in seconds, while values of 50 and above will be measured in milliseconds.
From a chart creation perspective
If the interval is set too fast, you might run into usability issues. If the interval is too slow, you may not have an accurate representation of your data. Control the number of ticks that will appear along the axis using the “max-ticks” attribute in the “refresh” object.
From a logistics perspective
If your end point only updates hourly but you request every minute or second, you are wasting resources. Graphical updates in a page are relatively taxing on the browser, so you’ll want to prevent unnecessary updates.
Real-time data and browser performance
There are two primary steps involved in updating a real-time data chart in ZingChart: parsing the data, and painting new chart elements. These steps occur at the end of every interval, as set via the “interval” attribute in the “refresh” object.
To see how this affects browser performance, let’s take a look at the performance profile for a real-time chart, as captured by Firefox’s performance tool.
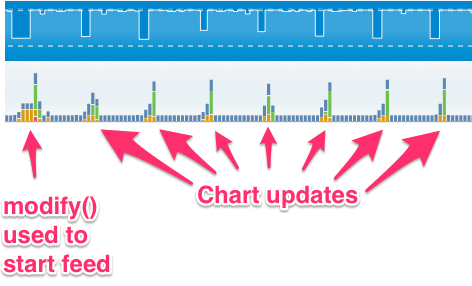
The top section, the frame rate timeline, gives an overview of the browser’s responsiveness over time. The bottom section shows platform code execution, giving you an overview of code execution over time.
Firefox’s performance tool will automatically examine the call stack and determine what the JavaScript code is doing, dividing up different types of actions into different colored bars.
At each chart update, we see yellow and green bars, which refer to inputs/events, and graphics, respectively. With this tool, it’s quite easy to see how parsing and painting impacts the overall performance of the browser, so set your update interval carefully, especially if there are other elements in the page that require significant processing power (this demo uses a page that is completely devoid of content, except for the chart itself).
Now, let’s give you a glimpse of what is going on in each update. Using an unminified version of the ZingChart library for this demo, we can see exactly what is happening at each chart update action. Let’s go under the hood and take a look.
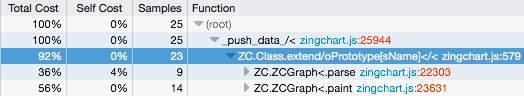
Digging down into the nitty-gritty details of a single update action, we now see the total cost of the parse and paint. During the parse action, ZingChart parses the new data provided by our window’s JavaScript function and determines options such as scale values, indices, color palettes, and other options that are to be used by the paint function. The paint function does just that: it paints Canvas/SVG elements. This includes the:
-
nodes
-
lines
-
bars
-
scale labels
-
value boxes
-
and more
Think of parse as the author of a recipe, and paint as the chef that cooks the dish and makes it presentable.
For fun, we put a simple jQuery animation in the page (this one). Take a look at the performance report now:
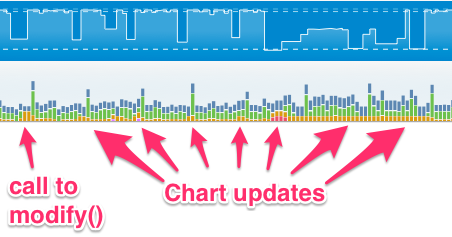
FYI: We examined these results using the unminified version of ZingChart.
As made evident by the turbulent nature of this report, animations and graphics are resource intensive processes. Keep this in mind when implementing real-time charts with ZingChart!
Garbage collection

As mentioned by UCSD professor (and ZingChart founder) Thomas Powell in "JavaScript: The Complete Reference", your browser’s JavaScript interpreter will automatically allocate browser memory for objects and other variables to use, and it will also “clean up” after you.
In terms of garbage collecting, JavaScript is more forgiving than other programming languages that require strict memory management. As soon as a piece of data is no longer in use, the interpreter will reclaim the previously occupied space and return it to the pool of available memory.
Since ZingChart is built dependency-free in JavaScript, it’s able to take full advantage of this user-friendly feature.
Real-time data charts FTW
Using real-time data opens up a number of features to add to your chart. You can learn more about these options and try out all the ZingChart has to offer for real-time data in this feed chart demo.