This is a part 2 of my previous post where we explored sending our chart to an OpenAI model in order to get a synopsis.
Previous Demo
Getting a synopsis of the chart is helpful but often it might not answer all of the questions you had about the chart. I might simply just want to know
What chart type is this?
Having to screenshot it manually and upload it to ChatGPT in another tab seems laborious, and looking through pages of chart types to find the one most similar will take forever.
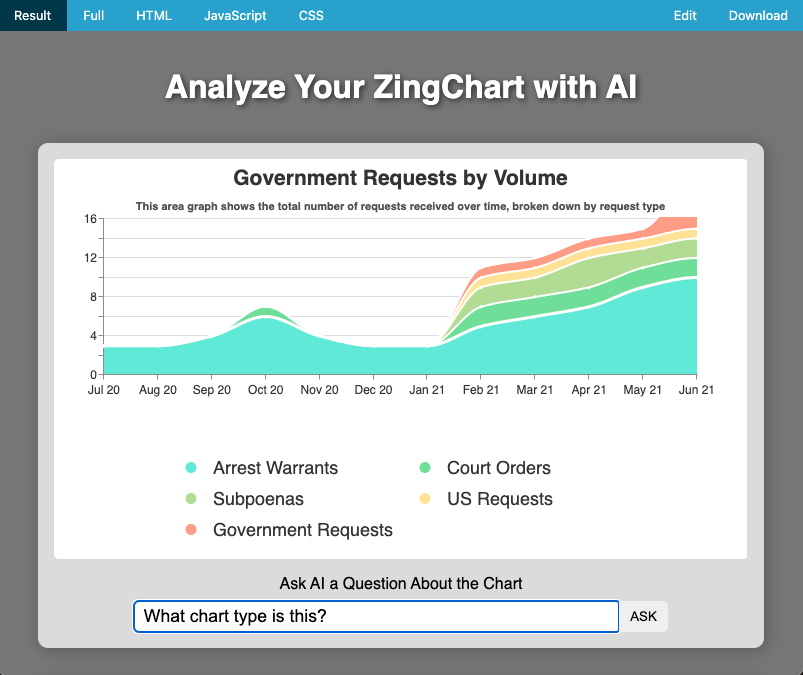
This query prompt allows us to send additional information along with the chart to ask any questions we want about it. You could imagine having prompts like these for any chart on your website so users can better understand what they're looking at.
Here is a video of it in action
Building the Query Form - Front End
We'll start by adding the markup for the query form itself. We'll add this at the bottom of our chart <section>. I chose to use a <form> here as it will be easier to grab the input out later (all of the styles to accompany this can be found in the demo at the end, they have been omitted here to save space).
<section id="sectionChart">
  <div id="zingChart"></div>
  <div id="chartQuery">
    <label for="query">Ask AI a Question About the Chart</label>
    <form id="queryForm">
      <input
        id="query"
        name="query"
        type="text"
        placeholder="Your query here..."
        autocomplete="off"
      />
      <button>ASK</button>
    </form>
  </div>
</section>
Next we hook this form up to the same analyzeWithAI() function we created in the previous post, with one slight modification: we are going to pass the query as a parameter.
function init() {
  // Render ZingChart
  zingchart.render({
    id: CHART_ID,
    data: chartConfig,
    height: '100%',
    width: '100%',
  });

  // Attach event listener to analyze chart on button click
  let analyzeChartBtn = document.querySelector('#sectionOutput button');
  analyzeChartBtn.addEventListener('click', () => analyzeWithAI());

  // Attach event listener to query form
  let queryForm = document.querySelector('form#queryForm');
  let queryInput = document.querySelector('input#query');
  queryForm.addEventListener('submit', (e) => {
    // Prevent the form from submitting
    e.preventDefault();
    // Grab the query out of the submitted form
    let query = new FormData(queryForm).get('query');
    // Analyze the query
    analyzeWithAI(query);
  });
}
Then, to wrap up our work on the front-end we modify two functions. First is our analyzeWithAI function where we pass the query to analyzeChart()
window.analyzeWithAI = function (query) {
  /* ... */
  analyzeChart(CHART_ID, query)
    .then((aiAnalysis) => {
       /* ... */
    })
    .catch((err) => {
      /* ... */
    });
};
And then next our analyzeChart function where we send the query to a different end point (that we will set up next).
/**
 * @param {string} chartId The ID of the chart to export the image from
 * @param {string} [query] The query to send along with the chart
 * @return {string} The AI's response of the image
 */
async function analyzeChart(chartId, query) {
  // Create the URL and Request Body for the AI request
  let url = SERVER_URL;
  let reqBody = { chartImage: await exportChartImage(chartId) };

  // Determine what type of request it is
  if (query) {
    url += ANALYZE_CHART_QUERY_API;
    reqBody.query = query;
  } else {
    url += ANALYZE_CHART_API;
  }

  try {
    let response = await fetch(url, {
      method: 'POST',
      headers: {
        'Content-Type': 'application/json',
      },
      body: JSON.stringify(reqBody),
    });
    return await response.json();
  } catch (err) {
    console.error('Trouble reaching endpoint', err);
  }
}
Building the Query Form - Back End
To tie it all together, we need to create the new POST request endpoint we used in the previous section. It's very similar to the previous endpoint, the only difference here being that we are passing along the query from the body of the request to the OpenAI model along with our image, before returning the results.
// Hit OpenAI endpoint to analyze chart with a query
appExpress.post('/analyze-chart-query', async (req, res) => {
  let chatCompletion = await aiClient.chat.completions.create({
    model: AI_MODEL,
    messages: [
      {
        role: 'user',
        content: [
          { type: 'text', text: `${req.body.query}` },
          {
            type: 'image_url',
            image_url: {
              url: req.body.chartImage,
            },
          },
        ],
      },
    ],
  });

  res.send(chatCompletion);
});
Final Results
The finished demo and code can be seen below, try typing in whatever question you'd like to ask about the chart.