Are you using ZingChart and curious how to pass functions? The attribute jsRule allows for this. JsRule works when you assign the name of a function which will be evaluated by ZingChart during the render process. You can make a better custom tooltip for your next chart with this attribute. Here’s how.
Why make a separate custom tooltip function?
There are a couple advantages to using a function for custom tooltips.
-
Creating a custom function to build your tooltips allows for a separation of concerns when building your graph.
-
You won’t clutter logic inside of the JSON like you would using our rules attribute.
-
Functions also allow for JavaScript interactions with variables outside of the scope of the graph, like global arrays.
Where can I use jsRule?
You can use the jsRule attribute in your configuration object. The attributes that accept jsRule are plot, tooltip, valueBox, plotLabel * scaleLabel.
tooltip : {
   jsRule : "window.customFncs.formatTooltip()"
}
Defining The Function
Since ZingChart is running in the global namespace, your function must be defined in that same namespace. For this demo, we have prefixed the function with window since we are running the example from an iframe. To avoid name collisions, we suggest using a wrapper variable like ‘customFncs’.
window.customFncs.formatTooltip = function(p) {}
Now what is this mysterious ‘p’ parameter?
This ‘p’ parameter is a callback argument provided by ZingChart. It is very similar to an event callback typically named e , evt or event. It will contain various properties about the graph including:
plotindexnodeindexgraphid- and many other useful bits of information when doing graph or ZingChart API interactions.
Once we have defined the function, we need to return something from our function. You will need to return an object with defined attributes that follow our declarative syntax. If you want to apply several attributes to the tooltip or valueBox, return an object like this:
return {
  text : tooltipText,
  backgroundColor : "#222"
}
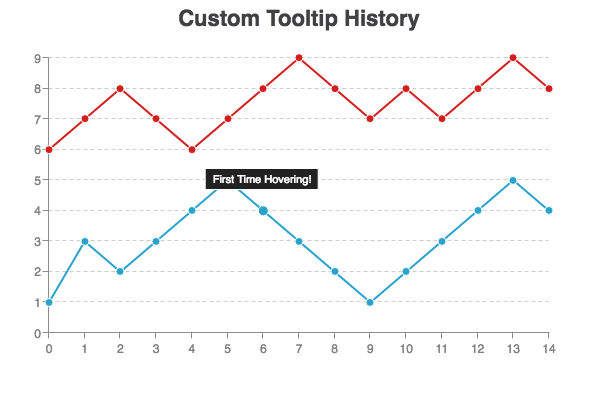
Putting It All Together
This example combines the above concepts, plus some basic programming logic, to display a custom tooltip. On the first hover of a node, we will display the message, “ 'First Time Hovering!'.” From there, we will hash that value so later on we can determine if we have visited this node. In more simple terms, your tooltip value will change based on the last interaction.
Will you make a custom tooltip with jsRule?
Hopefully this helped you become familiar with jsRule in ZingChart and can apply it to your own projects. I debated listing some use cases, but that would lead to a bias when approaching a task using jsRule yourself. We’d love to see examples of how you used jsRule in your application.

PS: Check our other blog post which also demonstrates a more complex example with jsRule.