Today, we’re sharing a high level overview of how to get a JSP chart up and running using ZingChart.
The data will be generated in Java and converted into JavaScript. You can find a comprehensive JSP-MySQL example on GitHub.
Make Your JSP Chart
To get this running, you need a server environment like Tomcat to render JSP pages. I used Docker to achieve this, but any VM will be sufficient. This blogpost is not about how spin up a VM for a runtime environment; that will be a later post.
For now, we will assume you have a runnable environment. If you don’t want to connect to MySQL and just run a quick JSP example with ZingChart, let's walk through the following code.
This next code snippet is my index.jsp from top to bottom.
Let's start off with a function that will create a string representation of an array.
<%@ page import="java.io.*" %>
<%@ page import="java.util.*" %>

<%!
    // --- String Join Function converts from Java array to javascript string.
    public String join(ArrayList<?> arr, String del)
    {

        StringBuilder output = new StringBuilder();

        for (int i = 0; i < arr.size(); i++)
        {

            if (i > 0) output.append(del);

              // --- Quote strings, only, for JS syntax
              if (arr.get(i) instanceof String) output.append("\"");
              output.append(arr.get(i));
              if (arr.get(i) instanceof String) output.append("\"");
        }

        return output.toString();
    }
%>
Next we are going to create fake data in a loop.
<!DOCTYPE html>
<html>
<head>
    <title>Simple JSP Demo</title>
    <script type="text/javascript" src="https://cdn.zingchart.com/zingchart.min.js"></script>
</head>
<body>
    <script>
        <%
           // --- Create two Java Arrays
            ArrayList<String> months = new ArrayList<String>();
            ArrayList<Integer> users = new ArrayList<Integer>();

           // --- Loop 10 times and create 10 string dates and 10 users
            int counter = 1;
            while(counter < 11)
            {
                months.add("Aug " + counter);
                users.add(counter++);
            }
        %>

       // --- add a comma after each value in the array and convert to javascript string representing an array
        var monthData = [<%= join(months, ",") %>];
        var userData = [<%= join(users, ",") %>];

    </script>
...
At the very bottom of the page, we will now render the graph.
<script>
window.onload = function() {
zingchart.render({
id: "myChart",
width: "100%",
height: 400,
data: {
"type": "bar",
"title": {
"text": "Simple JSP Example"
},
"scale-x": {
"labels": monthData
},
"plot": {
"line-width": 1
},
"series": [{
"values": userData
}]
}
});
};
</script>
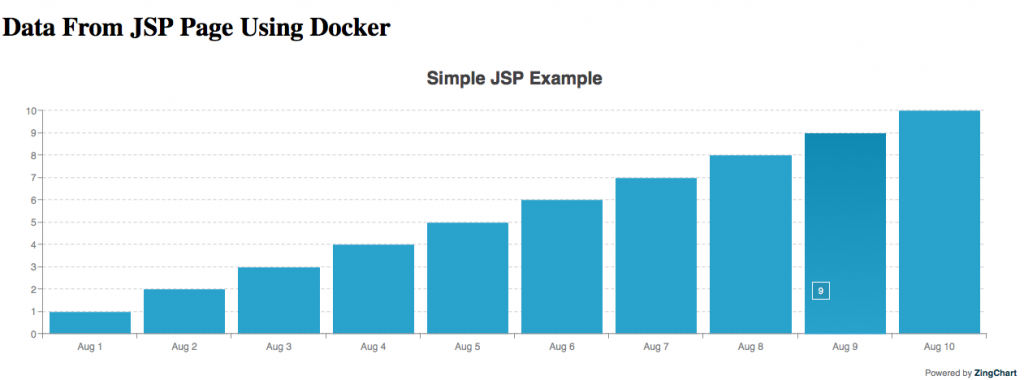
<h1>Data From JSP Page Using Docker</h1>
<div id="myChart"></div>
</body>
</html>
This is the output:
Charts for JSP, or any project
While this tutorial covered a JSP example, ZingChart is compatible with all web technologies. This may cover JSP pages, Java Servlets, or any hot new framework. When you choose ZingChart as your charting library, you won't be questioning what charts integrate with what language.
It will just work. Remember, a more comprehensive JSP example can be found in the ZingChart GitHub repo here.