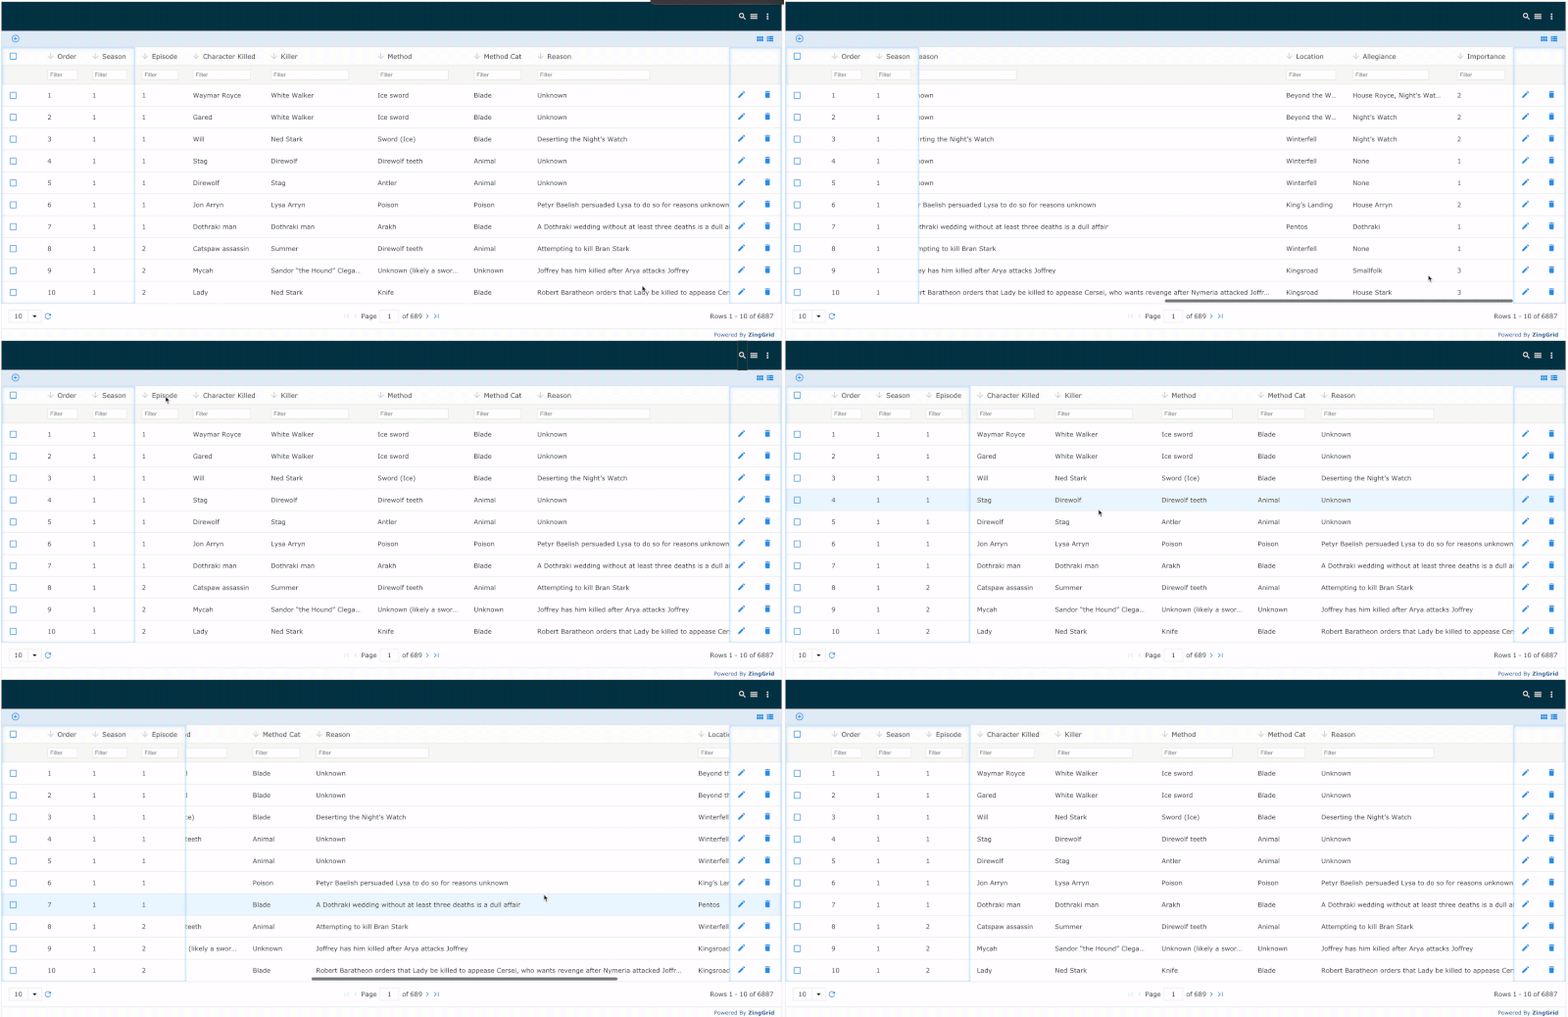
Two weeks ago we released ZingGrid v1.2.7, which gives you the power to add interactive frozen column functionality to your data grids and tables. This new feature makes it easier than ever to navigate and interact with large amounts of tabular data while some of it remains fixed as you scroll.
With ZingGrid you can now:
- Pin columns of data on the left or right side of your data grids while scrolling horizontally.
- Set multiple frozen areas within the same data grid.
- Drag and drop columns into frozen areas in your data grids.
In this blog post, you'll learn how to start using frozen column functionality in ZingGrid with just a few lines of code.
But first...
If you'd like an easy way to test this functionality out for yourself, head on over to the ZingSoft Studio, a free code sandbox-like environment where you'll have full access to the ZingSoft suite of data visualization products. Here you can experiment with the full set of features included in the ZingGrid and ZingChart libraries.
Step 1: Set up a basic grid
In this tutorial we assume you're working with a basic HTML web page, so first you'll want to make sure you've set up a basic grid by referencing the ZingGrid library in your development environment using either the CDN or self-hosted options.
The example below references the ZingGrid library using the CDN, and includes an empty data grid in the page body.
<!DOCTYPE html>
<html>
  <head>
    <meta charset="utf-8">
      <title>Hello ZingGrid</title>
      <script src="https://cdn.zinggrid.com/zinggrid.min.js" defer></script>
  </head>
  <body>
    <zing-grid caption="Hello ZingGrid"></zing-grid>
  </body>
</html>
Step 2: Add your data
For the purposes of this tutorial, we'll be adding data to our grid remotely using an API. If you'd like to learn about the other data types ZingGrid accepts, including inline data, view our docs. If you'd like to learn more about adding remote data, you can also find that info in our docs.
To link to our remote data source, we'll add the API URL to our <zing-grid> tag.
<zing-grid src="https://cdn.zinggrid.com/datasets/got-deaths.json"></zing-grid>
Next, we'll create a <zg-colgroup> container, and create a <zg-column> for each column of data we'd like to include in our data grid.
<zg-colgroup>
	<zg-column index="order"></zg-column>
	<zg-column index="season"></zg-column>
	<zg-column index="episode"></zg-column>
	<zg-column index="character_killed"></zg-column>
	<zg-column index="killer"></zg-column>
	<zg-column index="method"></zg-column>
	<zg-column index="method_cat"></zg-column>
	<zg-column index="reason"></zg-column>
	<zg-column index="location"></zg-column>
	<zg-column index="allegiance"></zg-column>
	<zg-column index="importance"></zg-column>
</zg-colgroup>
Step 3: Freeze!
Now that we've created a grid and added our data, we can specify which columns we want to freeze. ZingGrid gives us a few different ways to set our frozen columns.
Add columns via the <zing-grid> tag
The first way is by adding either the frozen-columns-left and/or the frozen-columns-right attributes to the <zing-grid> tag (or alternatively, if setting the attributes programmatically, we can write them out using camel case and that will still work). This will automatically freeze the first column on the left or right of our grid. We can also set a numeric value for either of these frozen column attributes to specify how many columns we'd like to freeze by default, e.g. frozen-columns-right="3".
Add columns via the <zg-column> tag
The second way to add frozen columns is by adding the frozen attribute to the <zg-column> tag. This gives us column-specific freezing control. The default value for frozen is left alignment, but either left or right alignment can be set as values for the frozen attribute.
Add draggable columns
Once we've added frozen columns to our data grid, it's very easy to enable functionality that lets us drag non-frozen columns of content into the frozen area, and vice versa. To do this, we'll add the column-drag attribute to the <zing-grid> tag.
Control column freezing via context menu
If we've added context menu functionality to our data grid using the context-menu attribute in the <zing-grid> tag, then we can automatically freeze and unfreeze columns from that menu without having to use any additional attributes. This provides a more visual way to interact with frozen column functionality within ZingGrid.
The Final Product
Here's what our code looks like if we add a frozen column via <zg-column>, add column dragging, and enable the context menu.
<!DOCTYPE html>
<html>
  <head>
    <meta charset="utf-8">
      <title>Hello ZingGrid</title>
      <script src="https://cdn.zinggrid.com/zinggrid.min.js" defer></script>
  </head>
  <body>
		<zing-grid context-menu column-drag pager src="https://cdn.zinggrid.com/datasets/got-deaths.json">
		    <zg-colgroup>
		      <zg-column index="order" frozen="left"></zg-column>
		      <zg-column index="season"></zg-column>
		      <zg-column index="episode"></zg-column>
		      <zg-column index="character_killed"></zg-column>
		      <zg-column index="killer"></zg-column>
		      <zg-column index="method"></zg-column>
		      <zg-column index="method_cat"></zg-column>
		      <zg-column index="reason"></zg-column>
		      <zg-column index="location"></zg-column>
		      <zg-column index="allegiance"></zg-column>
		      <zg-column index="importance"></zg-column>
		    </zg-colgroup>
		  </zing-grid>
  </body>
</html>
That's all it takes to add frozen column functionality to your data grids and tables using ZingGrid! Visit our docs if you'd like to learn what else you can do using ZingGrid!