
The video below, ‘Your First Chart’, is the first video in our ‘Getting Started’ series where I will show you how to implement key ZingChart features from the ground up. Below the video, we have included a written version of what was covered in the video.
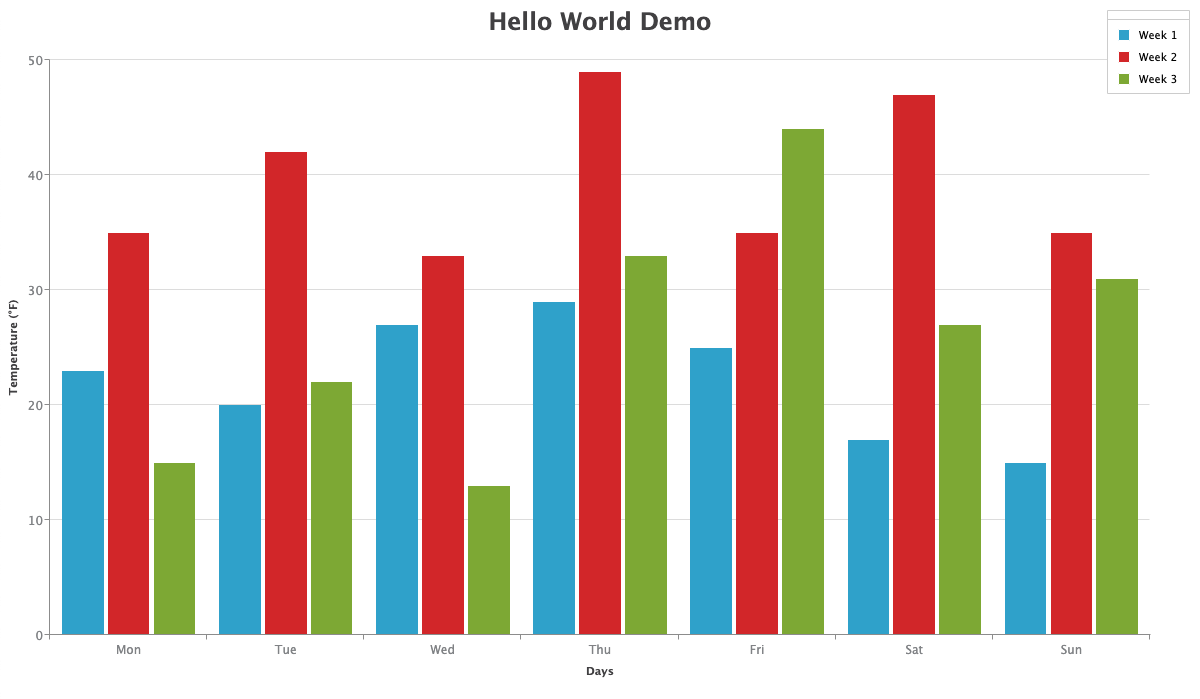
The chart below is the one I will be trying to render in this getting started tutorial.

If you hit ‘run’, you will notice that nothing renders; let’s dig in and find out why.
    id: 'myChart',         //Must match object defined previously
    data: chartConfig,     //Must match id created in HTML
    height: '700px',
    width: '1200px'
});
Looking at the ZingChart render method, there is a variable called “chartConfig”, which is a JavaScript object defined previously. This chart configuration is where all features are defined and is fully documented in our JSON configuration pages.
The second param we have is the id, “myChart”. What we need to do is create a div element with the corresponding id of “myChart” (as shown below).
<html>
  <head>
    <meta charset="utf-8">
    <title>ZingGrid: Blank Grid</title>
  </head>
  <body>
    <!-- CHART CONTAINER -->
    <div id="myChart" class="chart--container">
      <a class="zc-ref" href="https://www.zingchart.com">Powered by ZingChart</a>
    </div>
  </body>
</html>
I will create that element with the matching id and give it a class so I can apply some styling that has been predefined in my CSS.
If I hit enter and run the demo, you will still see that nothing is rendering. This is because I don’t have ZingChart registered to the page.
<html>
  <head>
    <meta charset="utf-8">
    <title>ZingGrid: Blank Grid</title>
  </head>
  <body>
    <!-- CHART CONTAINER -->
    <div id="myChart" class="chart--container">
      <a class="zc-ref" href="https://www.zingchart.com">Powered by ZingChart</a>
    </div>
  </body>
</html>
The easiest way to register and download the ZingChart library on the page is from the CDN. For other ways to reference the library, try visiting our docs.
<html>
  <head>
    <meta charset="utf-8">
    <title>ZingGrid: Blank Grid</title>
    <script src="https://cdn.zingchart.com/zingchart.min.js"></script>
  </head>
  <body>
    <!-- CHART CONTAINER -->
    <div id="myChart" class="chart--container">
      <a class="zc-ref" href="https://www.zingchart.com">Powered by ZingChart</a>
    </div>
  </body>
</html>
I created a script tag at the top of the page and pointed it to https://cdn.zingchart.com/zingchart.min.js. This will execute the ZingChart JavaScript library on the page making methods like zingchart.render() globally available.
When we run our demo again, we should see an empty chart.
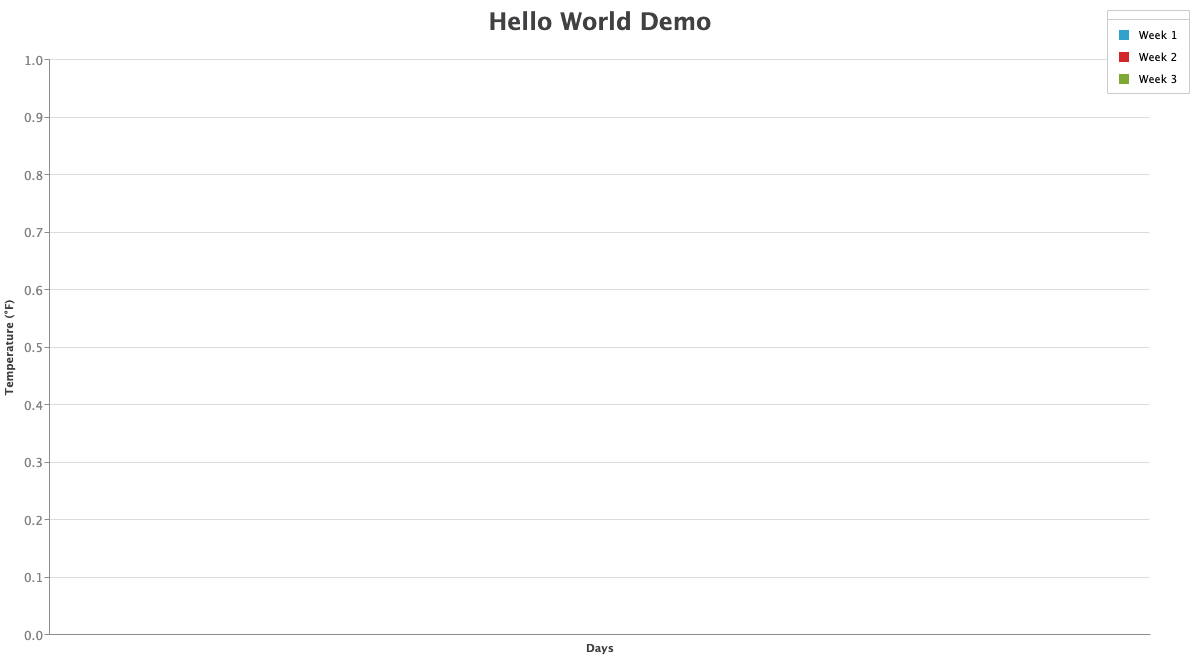
The chart is empty because we have not defined any values. The minimum attributes we need to render a chart are the type and values attributes within a series. series is an array of objects that contain values arrays. Reference below.
    series: [
      {
        // plot 1 values, linear data
        values: [23,20,27,29,25,17,15],
        text: 'Week 1',
      },
      {
        // plot 2 values, linear data
        values: [35,42,33,49,35,47,35],
        text: 'Week 2'
      },
      {
        // plot 2 values, linear data
        values: [15,22,13,33,44,27,31],
        text: 'Week 3'
      }
    ]
  };
If you include these values arrays (as shown above) and run the demo, you will see your charts rendered to the page.
Check back in later for our next video in our ‘Getting Started’ series, ‘Data Sources and ZingChart’.
A pioneer in the world of data visualization, ZingChart is a powerful JavaScript library built with big data in mind. With over 35 chart types and easy integration with your development stack, ZingChart allows you to create interactive and responsive charts with ease.