ZingChart’s JavaScript charting library can create hundreds of different chart types. However, this means there are many, many ways to include series data. Keeping track of how to properly format series data can be cumbersome. So the ZingChart team has developed a tool to make it easier than ever to reference how to format series data for every chart type.** **
An App for Formatting Data
When a charting library offers a selection of chart types as diverse as ZingChart’s, it can be difficult to keep track of how values should be arranged and configured. So we started developing the series data format application with the goal of making it as simple as possible for a user to get started with the chart type of their choice. The end result consolidates generic data structures, example code, and demo charts for each and every chart type into one easy-to-use application.
How to Format Series Data
To get started building charts, choose the desired chart type from the list on the left. This allows you to toggle between a generic data structure (template) view and a code view with sample values.
Template View
The benefit of this view is that it contains descriptions that shed some light on how data values work in a chart type, as well as how to format your data into a format recognized by ZingChart.
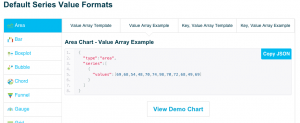
Example View
You can then toggle over to the code example, featuring a handy button that lets you easily copy and paste the complete chart JSON object into your own workspace. And setting up your own chart workspace is easier than ever, now that the team put ZingChart on a CDN and created several other ways to use the library.
Prefer working in a fiddle? We set up this example to demonstrate where to paste the JSON.

When To Use This Application
If you find yourself venturing into uncharted territory, sneak a peek at our data structure app to get the lowdown on how structure your data to get the most out of ZingChart or to quickly grab a ready-to-use template for your chart JSON.
Share Your Data Formatting Needs
We have a number of features and improvements that we are going to integrate into the default data format application in the coming weeks, but we would love to hear what you think would make it even better. Give the series data formatting app a spin and let us know what you would like to see in the comments below.