Adding charts to your React Application just got easier thanks to ZingChart’s revised React component.

The ZingChart team recently updated the zingchart-react component to create visualizations by adding more features and direct access to events and methods right on the component! We’re excited to show you how it works!
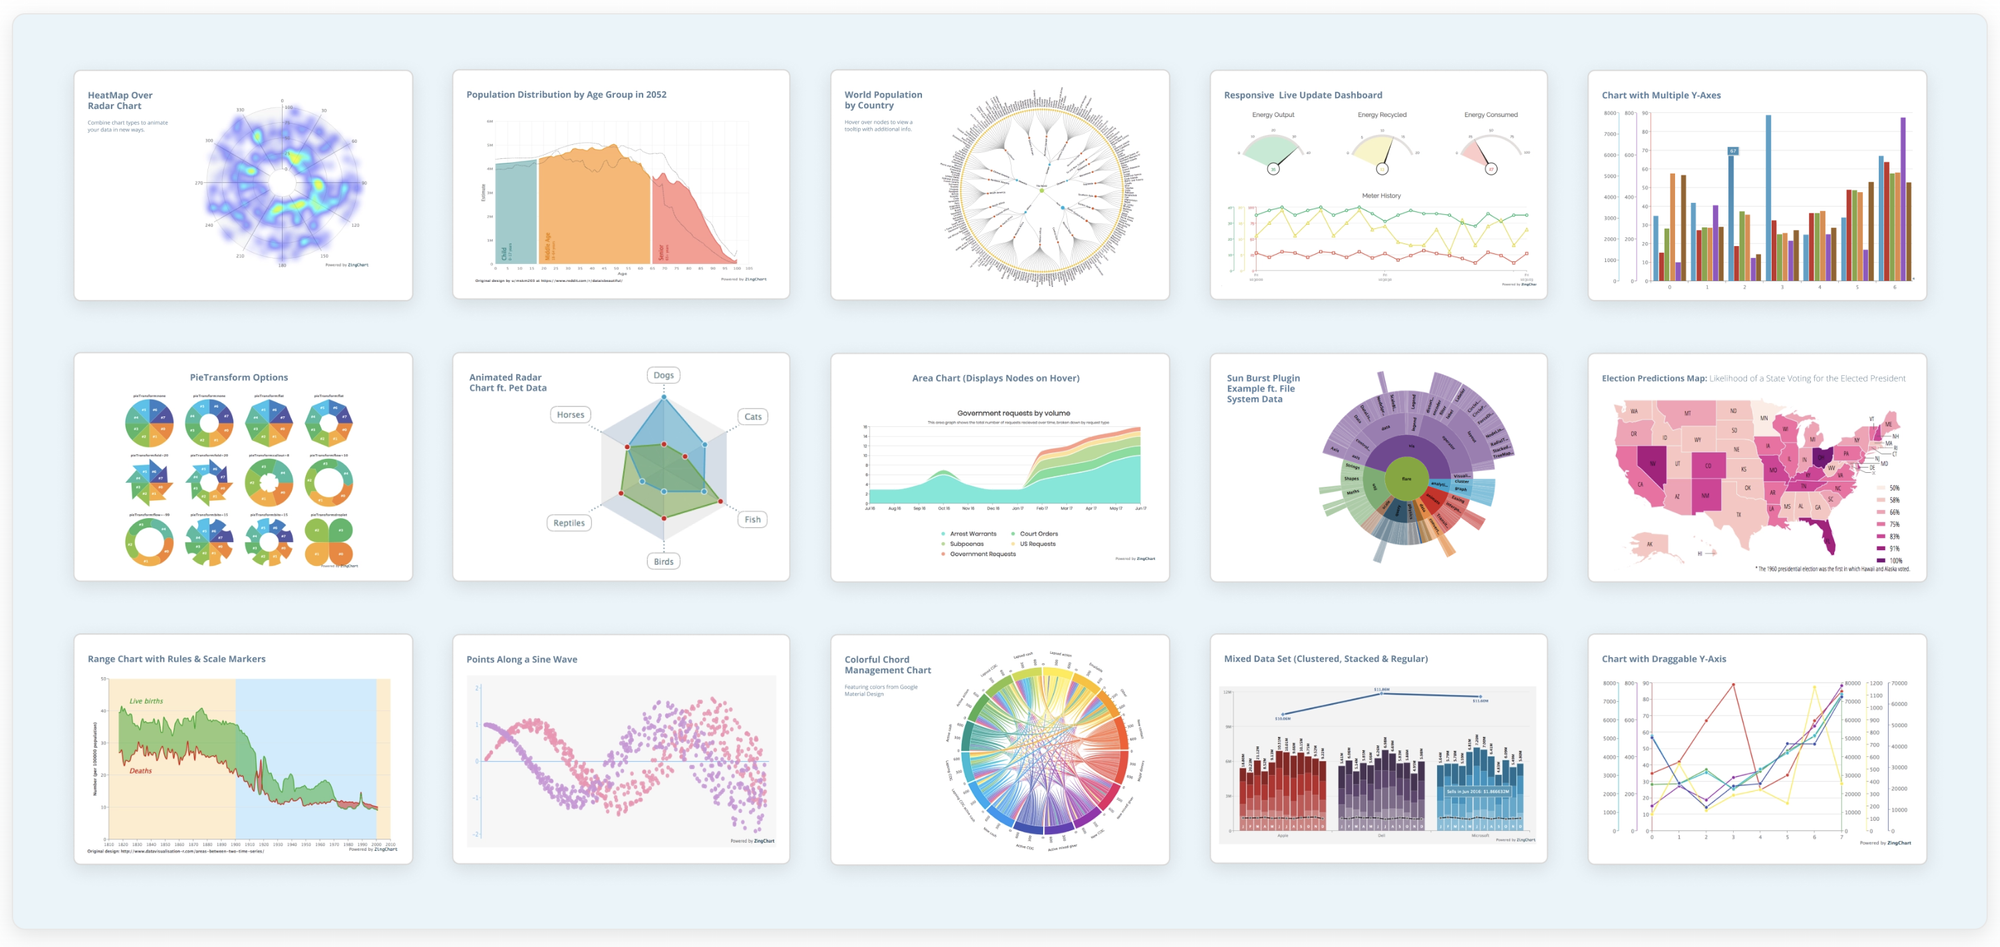
ZingChart — The last data visualization library you’ll need
ZingChart is one of the original JavaScript charting libraries, and continues to innovate and improve on its feature set. With over 35 different chart types, a rich API of methods/events to integrate with, and a dedicated support team, ZingChart provides an all-in-one solution for your data visualization needs.
Add charts to your React.js application in less than a minute
If you don’t have a React Application, you can easily set one up with create-react-app
$ npx create-react-app myApplication
First we add the package to our React Application via NPM:
$ npm i zingchart-react
We then include the component in the project file where we want a chart rendered.
import ZingChart from 'zingchart-react';Finally, we add a chart into our markup to be rendered!
class App extends Component {
  constructor(props) {
    super(props);
    this.state = {
      config: {
        type: 'bar',
        series: [{
          values: [4,5,3,4,5,3,5,4,11]
        }]
      }
    }
  }
  render() {
    return (
      <div>
        <ZingChart data={this.state.config}/>
      </div>
    );
  }
}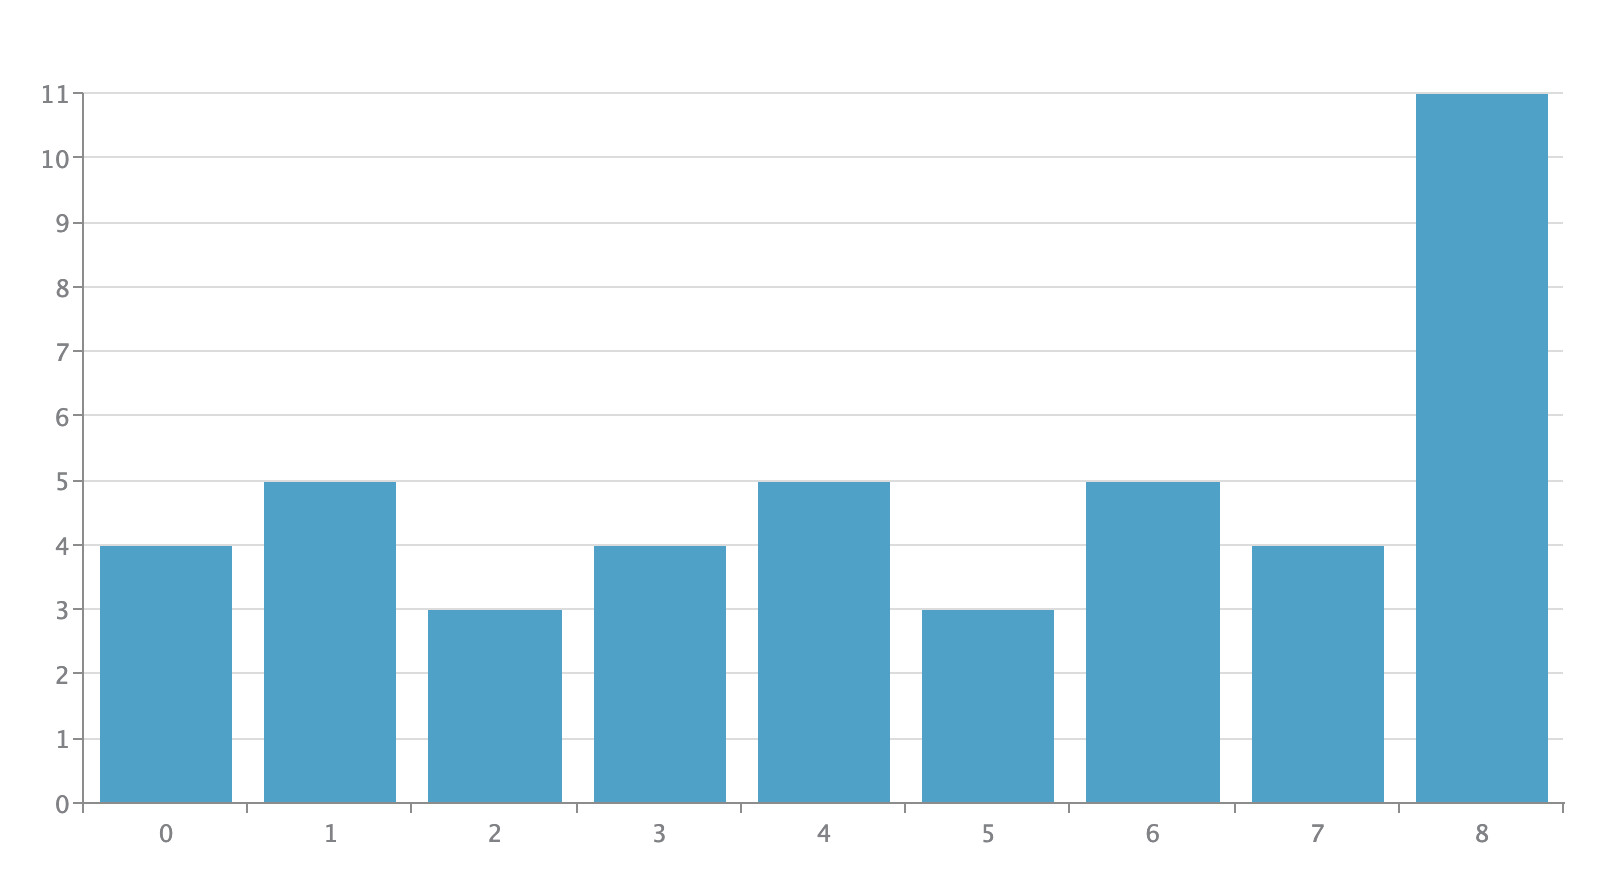
That was it! Only a few lines of code, and we have a fully reactive chart that updates when your data does.
Taking it a step further
The above example is a minimal example of how simple it is to create a chart in ZingChart, however, the library is powerful enough to make more complicated and interactive visualizations, too.
REACTivity
The zingchart-react component is reactive to all of its properties — from the chart configuration to the data. If any changes are sent to the component, the chart is re-rendered automatically.
Events and Methods — Tying your app together with ZingChart
The revised ZingChart component is all about connectivity to your React component. Events are automatically bound to the function you provide via props, and all available ZingChart methods are available when you access a specific component via refs.
Events
By binding a function to a known ZingChart event prop, we can perform custom actions when a chart emits an event. In the example below, the event node_mouseover is emitted and its contents are displayed.
<ZingChart ref={this.chart} data={this.state.config} node_mouseover={this.nodeInfo}/>
Methods
Methods can be called when a ref is given to the component, and a known method is called from the instance of the component. Below is an example of dynamically adding a plot, from a custom button created in React.
<ZingChart ref={this.chart} data={this.state.config}/>
...
this.chart.current.addplot({
  data: {
    values: [5,5,3,6,7,3,4,6,7],
    text: "My new plot"
  }
});
All of the above examples can be found on our glitch collection:
https://glitch.com/@zing-soft/react
Get Charting!
With a better understanding of ZingChart and its React component, all you need is to include it into your application. Head over to our GitHub repository for the full documentation of the component:
A pioneer in the world of data visualization, ZingChart is a powerful JavaScript library built with big data in mind. With over 35 chart types and easy integration with your development stack, ZingChart allows you to create interactive and responsive charts with ease.