This is Part 3 of the ZingChart Beginner’s Guide, where we’ll learn how to customize x and y axes, format numeric values, and use dynamic text in our labels and tooltips.
Is this not the guide you’re looking for? Try one of the others in this series:
-
Part 3: Axis Formatting and Dynamic Text (this tutorial)
Customizing Chart Axes and Labels
In the first tutorial, we updated our x-axis labels, title, subtitle, and series text to demonstrate that we were charting revenue for a telecom company.
Let's continue formatting our chart with helpful text to make it a great at-a-glance reference for our users.
Formatting Scale Values
Charting revenue means we're charting currency. How do we show currency values on our y-axis instead of plain numbers? Should we pass an array of string values to scaleY like we did scaleX? Technically, we could. But ZingChart gives you an easy, one-line solution to this problem:
scaleY:{
    values:"0:100:10"
    format:"$%v" //ZingChart does the work for you
}
What's going on here? What you're seeing is a ZingChart token doing the work for you - specifically the %v or "scale value" token. If we were to read that line like an instruction, it would say, "Format every value on the y-axis so that it is prefixed with '$' ".
Tokens are variables for ZingChart specific values. We will cover them in more depth later in this article, but we also recommend checking out the Tokens page for more examples and a full list of available tokens.
Short Units
Moving right along, our fictitious telecom company probably makes more than $500 per year - at least we hope so! Let’s update our values to represent more realistic revenue numbers.
Our revenue is off the charts! (Pun intended.) What happened? Do you remember in the first tutorial when we gave scaleY a specific set of values to display? ZingChart is still using those values. Let's remove them and let ZingChart do the work for us.
Looks like our y-axis values are a little lengthy. This is a good time to shorten them. We could do it manually by giving the y-axis an array of hard coded values, but if we've learned anything from this guide so far, it's that ZingChart probably has a handy attribute for us to use!
Lo and behold, we can set the short attribute to true inside of our scaleY object.
The short attribute will truncate your values and append the appropriate abbreviation - M for millions in our case.
ZingChart contains many different attributes to help you format your data. Be sure to check out the Data Formatting article for more information.
Axis Lines and Ticks
If we take another look at our chart, we notice that the color of the axes doesn’t really jive with the color palette we’ve chosen. Let’s change them to a more neutral gray:
Setting lineColor on our axes worked just fine, but the small lines that indicate intervals are still blue. Those small lines are called ticks and tick lineColor is independent of axis lineColor.
That’s because ticks are their own objects inside of the scaleX and scaleY objects, giving you even more control of your chart. With that in mind, let’s create a tick object inside of each axis and set lineColor inside of those:
There are plenty of other attributes available to style both ticks and the axes, so be sure to check the scale and tick JSON attributes pages for more information,but this is perfect for our chart. Let’s move on.
Guide
In ZingChart, the guide is the set of grid lines on the background of the plot area. In ZingChart, the x-axis and y-axis guide is enabled by default for Cartesian charts, just like the axes themselves.
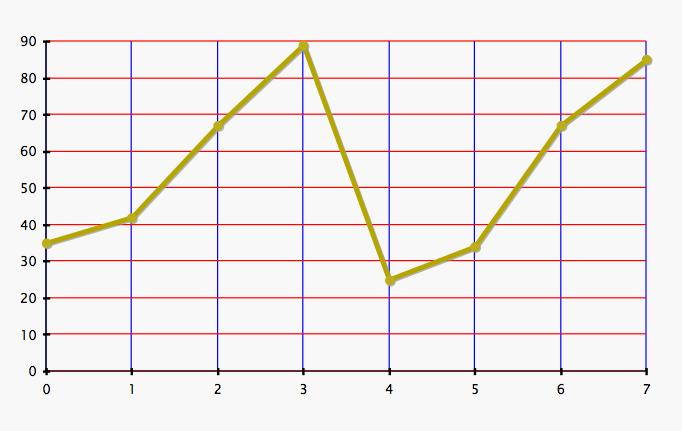
In the image below, the scaleX guide has been colored blue and the scaleY guide has been colored red.
In our chart, we'd like to hide x-axis guide so it's easier to use the y-axis guide at a glance. The guide is an object nested inside of the scaleX and scaleY objects.
As we mentioned in a previous tutorial, most objects can be hidden by setting their visible attribute to false. Let's do that now.
Scale guides can be customized and styled in plenty of ways. Take a look at the guide JSON attributes page for more information.
Dynamic Text
We were briefly introduced to ZingChart tokens a few sections ago when we used %v in our scaleY format string. Tokens are also incredibly useful in tooltips, where they can help you tell your users more about the node they're hovering over.
Right now, our tooltips just give us the value of the node, no frills.
It would be more helpful to the user if they saw a formatted value like they see on the y-axis. We already know that we can set short to true to abbreviate the value, and we also know we can use the %v token to get the value of scaleY at that node.
There's no limit to the amount of tokens you can use in a text string. Let's add the quarter and the name of the series. For example, we'd like a tooltip to say something like "Q2: 9.2M in Internet Sales".
Quarter is the scaleX value and represented by the token %kt; the name of the series is represented by %t.
Easy, right? If you're not sure which token to use, a full list is available on the Tokens page. Once you get more comfortable with using the ZingChart library, you can even make your own custom tokens.
Next Steps
We've covered a lot of ground so far! Now that we know how to style charts and use tokens for dynamic text and labels, it's time to move on to more advanced topics like conditional styling and custom buttons. Move on to the next guide to learn more.
Part 4: Markers, Labels, and Rules
Want some more in-depth ZingChart education? Visit our docs page! Have some more questions? Visit our help center!